Plastic Pipe and Tube Packing: Solutions for Industry

πŸ› οΈ Evaluation Criteria

Selecting between automated and manual pipe bagging requires a rigorous analysis of throughput velocity, labor dependency, seal integrity, material yield, and total cost per unit over a twelve-month operational horizon. These five technical parameters dictate whether mechanization delivers a viable return on capital expenditure.

Production scaling decisions must be grounded in measurable operational metrics rather than subjective workflow preferences. Throughput velocity directly influences labor allocation and order fulfillment latency, while operator dependency determines fixed overhead exposure. Seal failure rates dictate rework expenditure and downstream warranty liability, typically ranging from $2.00 to $5.00 per rejected unit in standard manufacturing environments. Film waste percentages directly impact gross margin, with misaligned sleeves or over-trimming adding $0.03 to $0.10 per pipe depending on polymer grade. First-pass label accuracy governs retail compliance and supply chain routing efficiency. Note: All financial metrics and yield percentages cited herein represent industry estimates derived from mid-volume PVC/PE production facilities and may vary based on regional labor rates and film supplier specifications.

πŸ—οΈ Automatic Pipe Bagging System

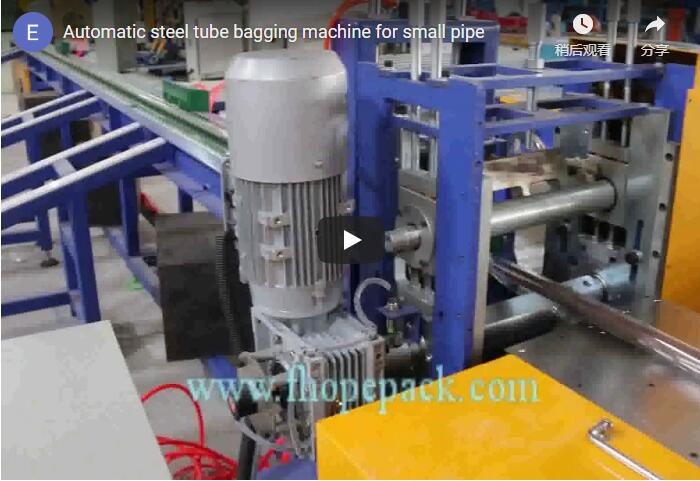
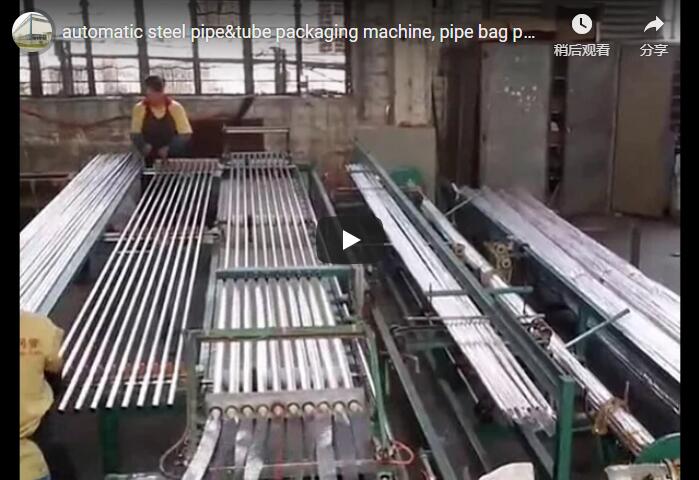
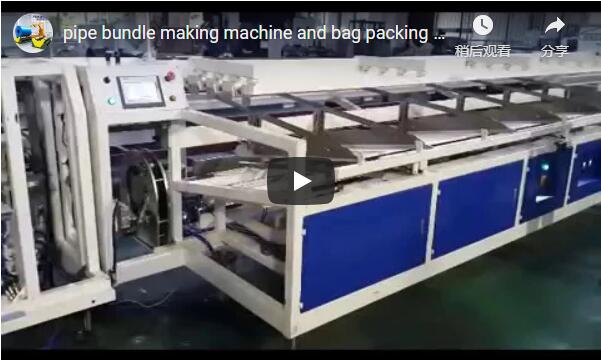
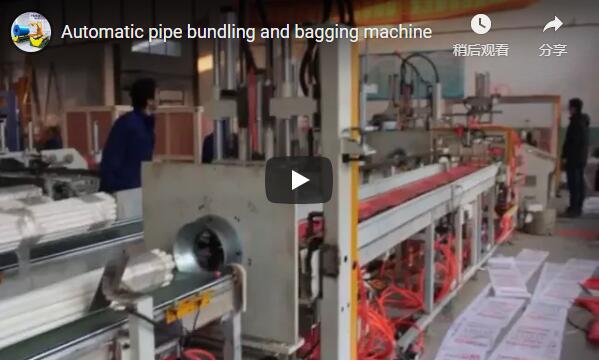
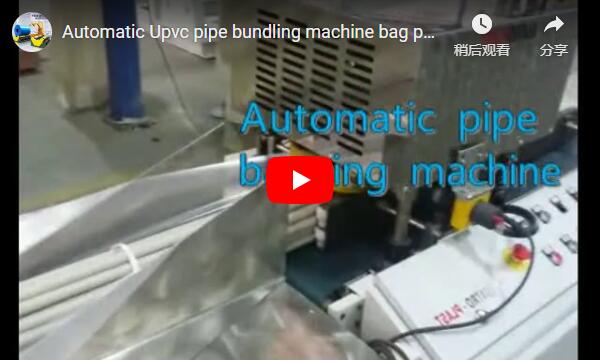
Automated bagging lines integrate continuous film handling, precision product insertion, and programmable thermal sealing into a single synchronized workflow, typically processing eight to fifteen units per minute under closed-loop temperature regulation. This mechanized architecture eliminates manual variance while maintaining strict dimensional tolerances across diverse polymer substrates.

This system accommodates PVC, PE, PP, PPR (Polypropylene Random Copolymer), and PB (Polybutylene) pipes ranging from 15 to 630 millimeters in outer diameter, with standard lengths up to six meters. Throughput velocity scales inversely with pipe diameter due to handling dynamics and film tension requirements. Small-diameter plumbing conduits (15–110 mm) achieve 12–15 bags per minute, whereas municipal-grade pipes (315–630 mm) operate at 8–10 bags per minute. Thermal sealing parameters must align with polymer melt indices: constant-temperature heat sealing (120–180Β°C) optimizes high-density polyethylene (HDPE) bonds, impulse sealing (180–220Β°C) ensures clean cuts for polyolefin (POF) shrink films, and ultrasonic welding (60–80Β°C) prevents thermal degradation of specialized ABL (Aluminum Barrier Laminate) or PBL (Plastic Barrier Laminate) substrates. Integration with post-seal shrink tunnels provides UV and moisture resistance for outdoor storage compliance. Performance variability is directly tied to pipe surface roughness, ambient humidity, and film tensile strength; operators must calibrate dwell time and pressure according to ISO 1167 and ASTM D638 standards.

πŸ”— Related: Explore more solutions

πŸ“ˆ Manual Pipe Bagging

Manual bagging relies on sequential operator intervention for film sleeving, localized heat application, and adhesive labeling, yielding forty-five to sixty seconds per unit with higher variance in seal consistency and label placement accuracy. This labor-intensive approach remains economically viable only for low-volume runs or constrained capital environments.

Cycle times are strictly functionally dependent on operator proficiency and pipe geometry. Standard workflows require two to three personnel per line to manage bag placement, heat sealing, and labeling sequentially. Seal rejection rates typically fluctuate between 3% and 8% due to inconsistent thermal dwell and uneven pressure distribution across the film seam. Material waste averages 8% to 12%, driven by manual misalignment and excessive trim allowances. First-pass label accuracy rarely exceeds 70% to 85%, necessitating manual correction loops that compound labor hours. Hidden operational costs include rework labor ($2–$5 per failed seal) and compliance penalties from mislabeled inventory, which can escalate to $20–$50 per incident in replacement logistics and administrative overhead.

πŸ›‘οΈ Comparative Performance Metrics

Direct performance comparison reveals that automated systems achieve three to five times higher shift throughput while reducing seal rejection rates below half a percent and cutting film waste by more than fifty percent compared to manual workflows. These efficiency gains directly translate to optimized labor allocation and improved gross margin stability.

The following parameters quantify the operational divergence between mechanized and manual processing methods:

Metric Automated Integration Manual Processing
Shift Throughput (8 hrs) 1,920–3,600 pipes 480–640 pipes
Labor Requirement 1 supervisor 2–3 direct operators
Cycle Time per Unit 4–7 seconds 45–60 seconds
Seal Rejection Rate <0.5% 3–8%
First-Pass Label Accuracy 98%+ 70–85%
Film Waste Yield 2–4% 8–12%
Estimated Capital Outlay $35,000–$80,000 $2,000–$5,000
Estimated Labor Cost/Unit $0.02–$0.05 $0.15–$0.30
Changeover Duration 10–20 minutes Instantaneous
Optimal Daily Volume >500 pipes <200 pipes

All capital expenditure and unit cost figures are industry estimates based on standard 250 operating days per year and regional average manufacturing wages. Actual deployment costs will vary by facility infrastructure and supplier contracts.

πŸ”— See Also: Related equipment

βš™οΈ Strategic Selection Framework

Production volumes exceeding five hundred pipes daily strongly favor automated integration, as labor displacement and material savings typically recover capital investment within six to eighteen months under standard operating assumptions. Conversely, sub-two-hundred-unit daily runs or frequent SKU changeovers justify manual processing to avoid unnecessary depreciation overhead.

Decision modeling requires a structured baseline assessment. First, quantify current shift output and headcount allocation. Second, audit historical rejection rates and label compliance failures to establish a rework cost baseline. Third, project unit economics: automated systems typically yield $0.10–$0.25 in savings per pipe at 1,000-unit daily volumes. Assuming a 250-day operating year, 2-shift operation, and a $0.15 per-unit savings margin, annualized savings approximate $75,000, enabling a $40,000 system payback in approximately 6.4 months. ROI projections assume consistent 8-hour shifts, standard labor rates, and zero unplanned downtime. Actual payback periods extend to 24–30 months for volumes below 500 pipes/day or in regions with lower labor differentials. Large-diameter pipes (>400 mm) and retail-compliant packaging requirements further justify automation due to the physical impossibility of maintaining consistent thermal bonds and barcode precision manually.

πŸ› οΈ Procurement Validation Checklist

Validating a bagging system purchase requires cross-referencing pipe dimensional tolerances, film polymer compatibility, daily throughput targets, and existing utility infrastructure against manufacturer specifications before contract execution. This engineering verification prevents integration failures, ensures operational continuity, and mitigates unexpected commissioning delays.

Pre-purchase engineering validation must address the following technical requirements:

  • Confirm outer diameter range (15–630 mm standard; up to 800 mm custom) and maximum length (6 m standard, 12 m optional).

  • Verify film substrate compatibility (PE, POF, anti-static, or ABL/PBL barrier laminates) against available sealing modalities.

  • Benchmark daily production volume against the 500-pipe/day automation threshold.

  • Audit current seal rejection metrics; rates exceeding 3% mandate mechanized thermal control.

  • Measure first-pass label accuracy; sub-90% compliance justifies integrated vision-guided applicators.

  • Validate facility utility capacity (220V/380V single or three-phase power, 4–6 bar compressed air supply).

  • Request live video validation using actual production samples to verify film tension and seal consistency.

  • Negotiate a comprehensive 12-month spare parts inventory and preventive maintenance schedule within the master quotation.

All specifications assume standard industrial facility conditions. Site-specific constraints, such as elevated ambient temperatures or high particulate environments, may require additional filtration or climate control modules.

πŸ—οΈ Technical Implementation FAQ

Automated bagging equipment accommodates standard plumbing and municipal pipe diameters up to six hundred thirty millimeters, with material-specific thermal profiles enabling rapid changeovers between polyolefin and polyvinyl chloride substrates. System footprint requirements and capital recovery timelines remain strictly contingent on facility layout constraints and production scheduling parameters.

What dimensional tolerances can the system accommodate? Standard configurations process 15–630 mm outer diameters. Custom tooling extends capacity to 800 mm, though throughput decreases proportionally due to increased film surface area and handling inertia.

Can a single line process both PVC and PE substrates? Yes. Modern controllers utilize pre-saved thermal recipes that adjust sealing temperature, dwell time, and cooling duration automatically. Material changeovers typically require 5–10 minutes of parameter validation and film reel replacement.

Is mechanization economically viable for agricultural irrigation conduits? For PE pipes (20–200 mm), automated bagging extends shelf stability from 6 to 24 months by mitigating UV degradation and particulate contamination. At 10–12 bags per minute, ROI accelerates significantly when daily volumes exceed 500 units.

What is the required production footprint? A complete integrated line (magazine, conveyor, sealer, labeler) occupies approximately 6 m Γ— 2 m, excluding inbound/outbound staging zones. Manual setups require roughly 50% less floor area but demand wider operator clearance for safe material handling.

How is the capital recovery period calculated? Mid-volume facilities (1,000 pipes/day, dual shifts) typically achieve payback within 6–18 months, factoring in installation, calibration, and operator training. Lower-volume operations or single-shift facilities may experience 24–30 month recovery windows. All implementation timelines assume standard commissioning protocols and uninterrupted production scheduling.