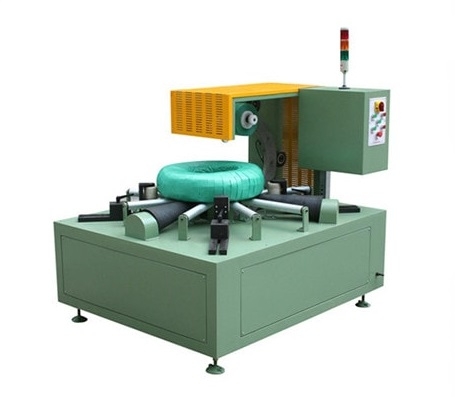
Is a Coil Packing Line Cheaper Than Manual Packing?
The purchase price is only a fraction of coil packing line ownership cost. Compare automation vs. manual packing on labor, material, quality, maintenance, and useful output—then find the break-even point with conservative, expected, and optimistic scenarios.
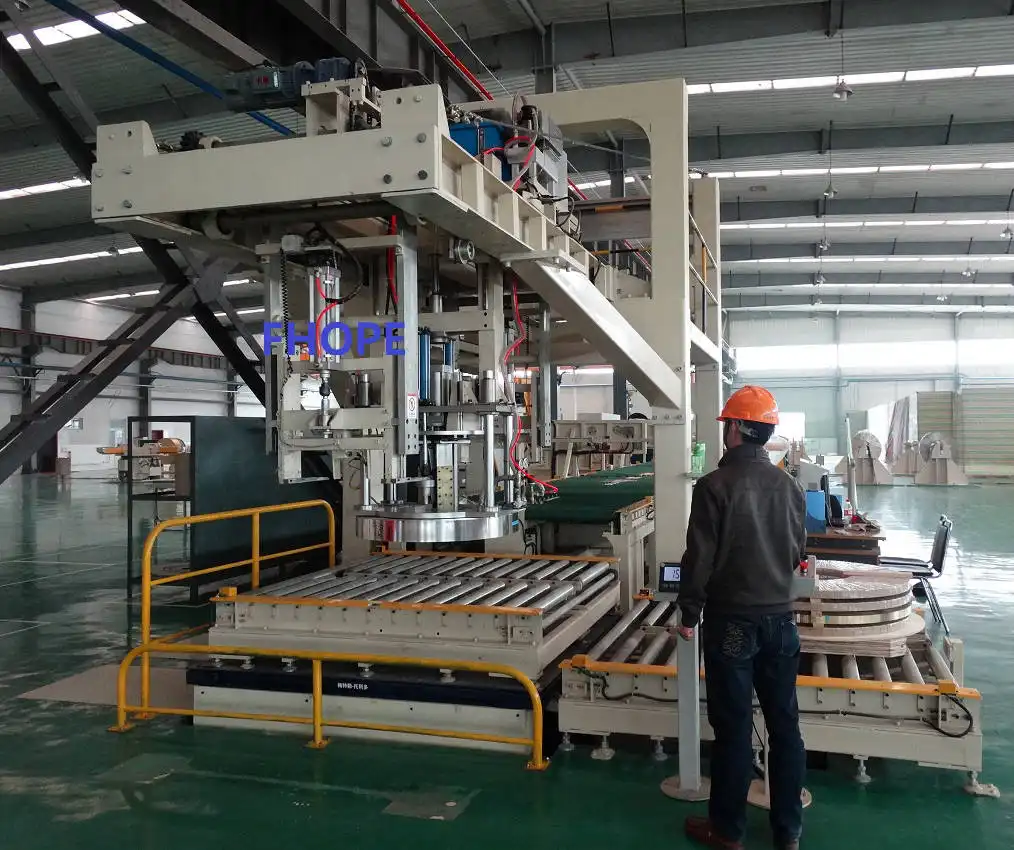
Total Cost of Ownership: Coil Packing Line vs. Manual Packing
Total Cost of Ownership: Coil Packing Line vs. Manual Packing
The purchase price is a small part of what a coil packing line costs over its life. Manual packing can look cheaper at the first invoice and become more expensive when labor, rework, material waste, safety, and missed output are counted over time.
This guide helps managers and finance teams compare an automatic coil packing line and manual packing on the same operating boundary.
| Cost area | What to count |
|---|---|
| Labor | Direct labor, temporary and overtime labor, supervision |
| Material | Film, paper, VCI, strapping, labels, and consumables |
| Quality | Rework, packaging defects, and handling damage |
| Capital and maintenance | Equipment, installation, utilities, spares, and maintenance |
| Output | Accepted coils per shift, after rework and rejects |
Define the Comparison Period
Choose a realistic ownership period, such as five or ten years, and keep it the same for both options. The period should reflect the expected life of the line and the expected change in product mix.
If the comparison period is too short, the automation capital cost dominates. If it is too long, the assumptions become less reliable.
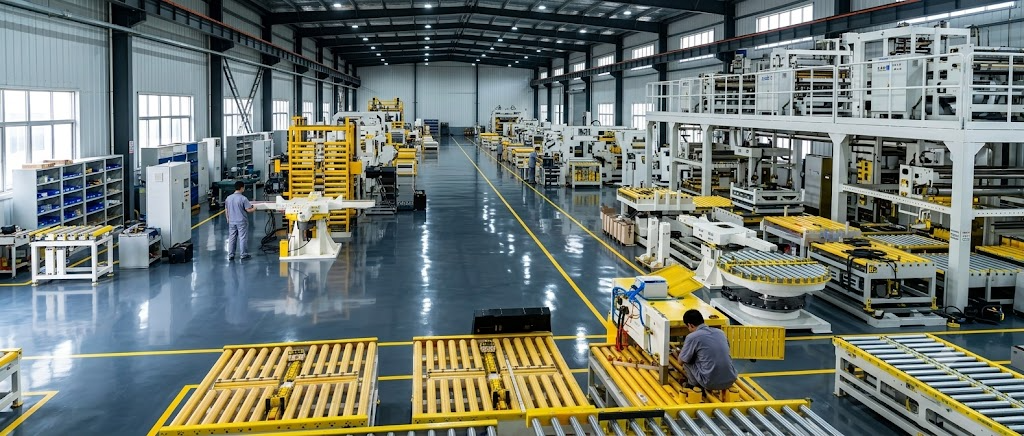
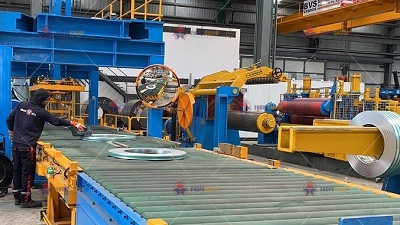
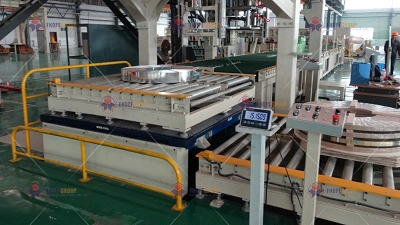
The image shows conveyor loading. The manual-packing baseline and the line option both start at the same point: how the coil is presented, loaded, and handled before and after the packing process.
Count the Manual-Packing Baseline
Measure the full cost of the current process:
- Direct labor and shift pattern.
- Temporary or overtime labor.
- Rework and packaging defects.
- Wrapping film, paper, VCI, strapping, and labels.
- Handling equipment, tools, and consumables.
- Injuries, near misses, and the cost of heavy manual handling.
- Time lost to waiting, re-handling, and manual data entry.
The baseline should include the costs that are often spread across different departments.
Count the Line's Total Cost
Include more than the equipment price:
- Installation, foundation, utilities, and integration.
- Training and start-up support.
- Energy, compressed air, and maintenance.
- Spare parts and wear parts.
- Wrapping and strapping material.
- Remaining operators and supervision.
- Financing or opportunity cost if relevant.
A line that reduces direct labor but creates a new maintenance or data burden is not automatically cheaper.

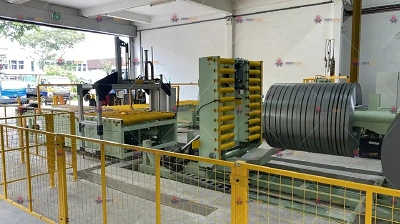
The image shows an automatic steel coil strapping machine. Its total cost includes the equipment, the interfaces around it, the spare parts, and the maintenance capability that must be available over the whole period.
Compare on Useful Output
Use the same output boundary for both options: accepted coils per shift, after rework and rejects. Do not compare the manual option's actual output with the line's theoretical output.
If the line is expected to reduce defects or material consumption, show the measured baseline and the evidence that supports the change.
Include Risk and Flexibility
Manual packing is more flexible in the short term but depends on available labor and consistent performance. An automatic line can reduce variability but is less flexible when the product mix or space changes.
State which risks each option transfers and which risks it creates.
Show the Break-Even Point
Calculate when the line's cumulative cost becomes lower than the manual baseline. The break-even point should be shown with conservative, expected, and optimistic assumptions rather than a single number.
If the break-even point is sensitive to one assumption, the team should verify that assumption before approval.
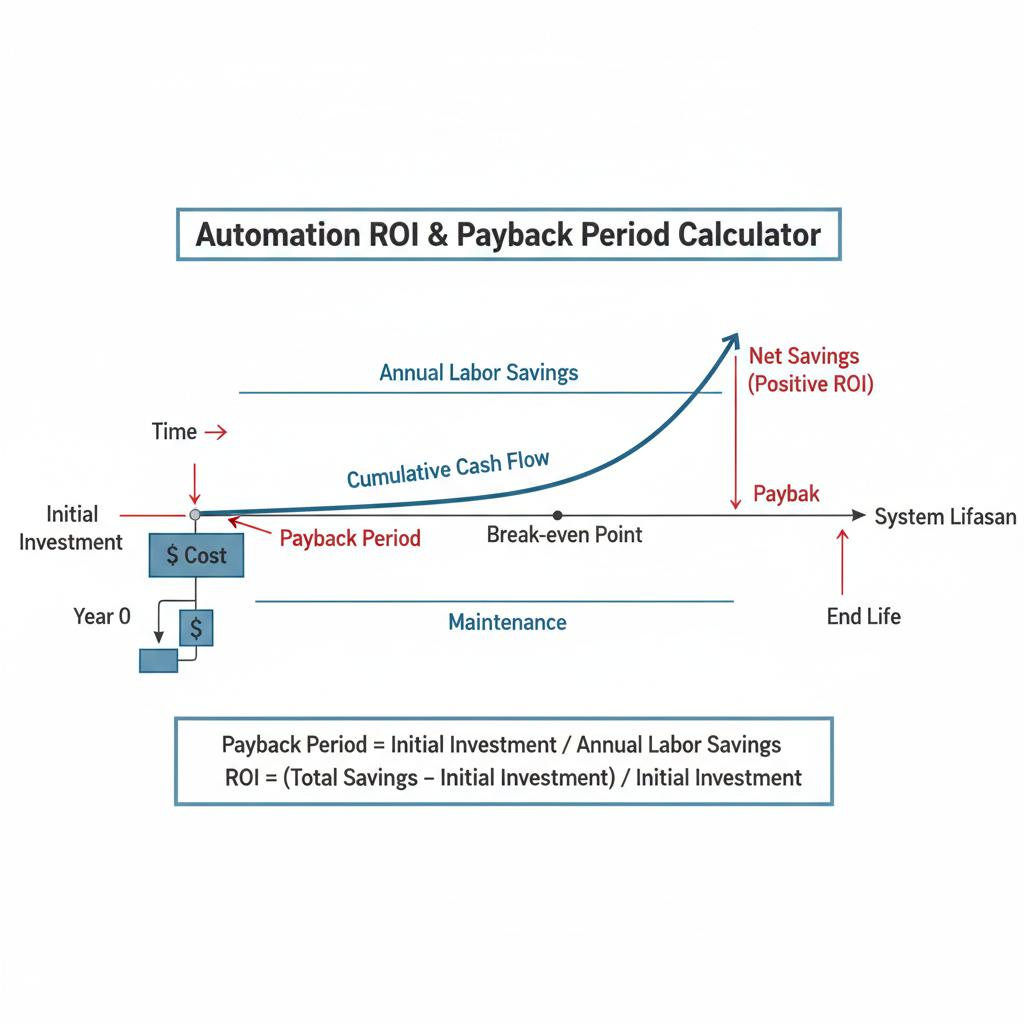
The image shows an automation ROI and payback period visual. The TCO comparison should show the same kind of curve: when cumulative line cost crosses below the manual baseline, and how much that point depends on assumptions.
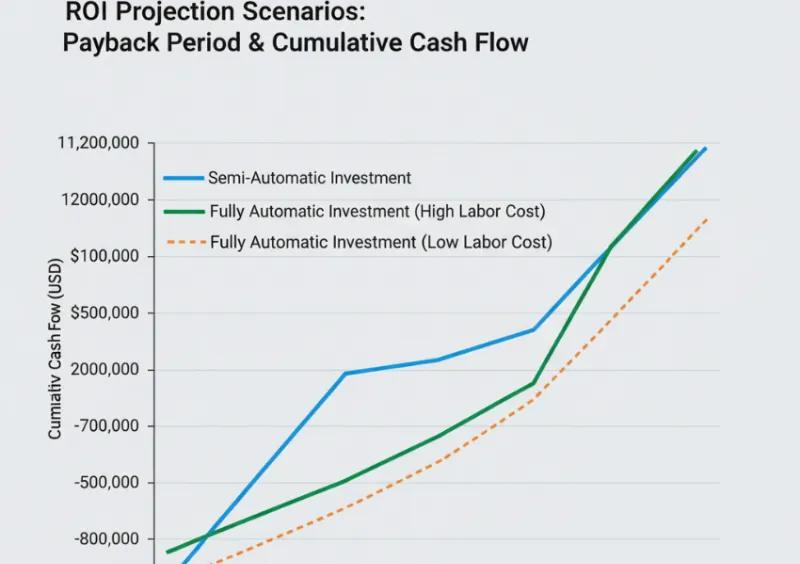
The image shows an automation ROI and payback period calculator. It represents the model format the team needs: visible inputs for labor, material, output, maintenance, and period, with the break-even result changing as those inputs change.
A Practical Next Step
Build a total-cost table for both options over the same period, using the same output boundary and clearly separated assumptions. Review it with operations, finance, maintenance, and safety before making the investment decision.
Keep the same assumptions visible for the automatic coil packing line and manual packing so the comparison can be audited later.
Watch a complete aluminum coil packaging line from upending to stacking:

Visual Details
Click to enlarge
Click to enlarge
Click to enlarge
Click to enlarge
Watch How It Works
Discover how our automated packaging solutions optimize your production line efficiency. This video demonstrates the seamless operation designed for maximum protection.
Trusted by Steel Mills & Industry Leaders
Global manufacturers rely on FHOPE heavy duty packaging equipment


Ready to optimize your packaging line?
Get a custom quote with ROI analysis. Our engineers respond within 24 hours.
- Free layout design
- Global installation support
- 2-year warranty included
Your information is secure and will never be shared.
Related Machines
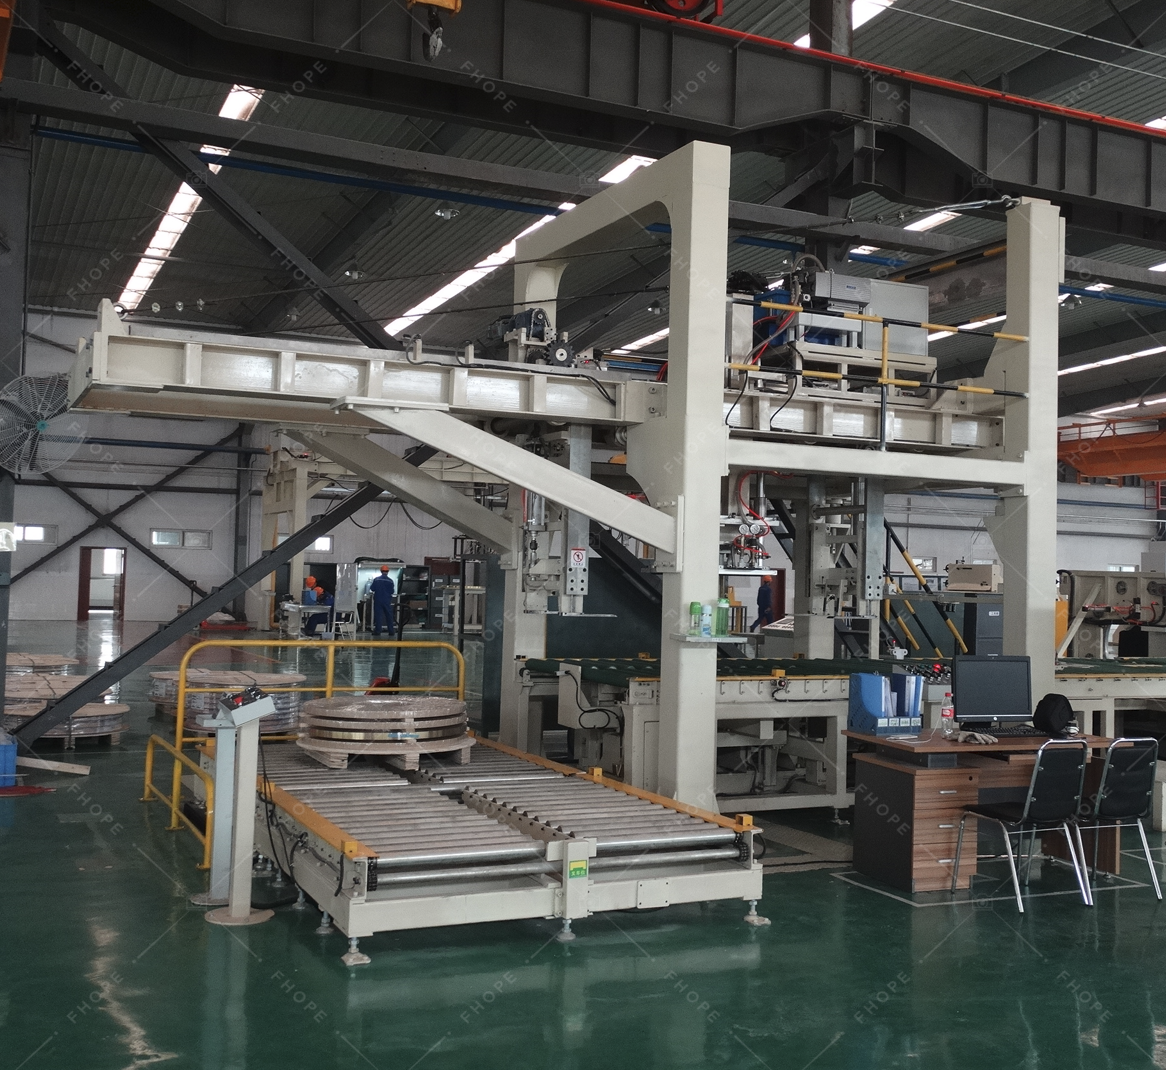
Steel Coil Packaging line
View Details →
Vertical coil packaging line
View Details →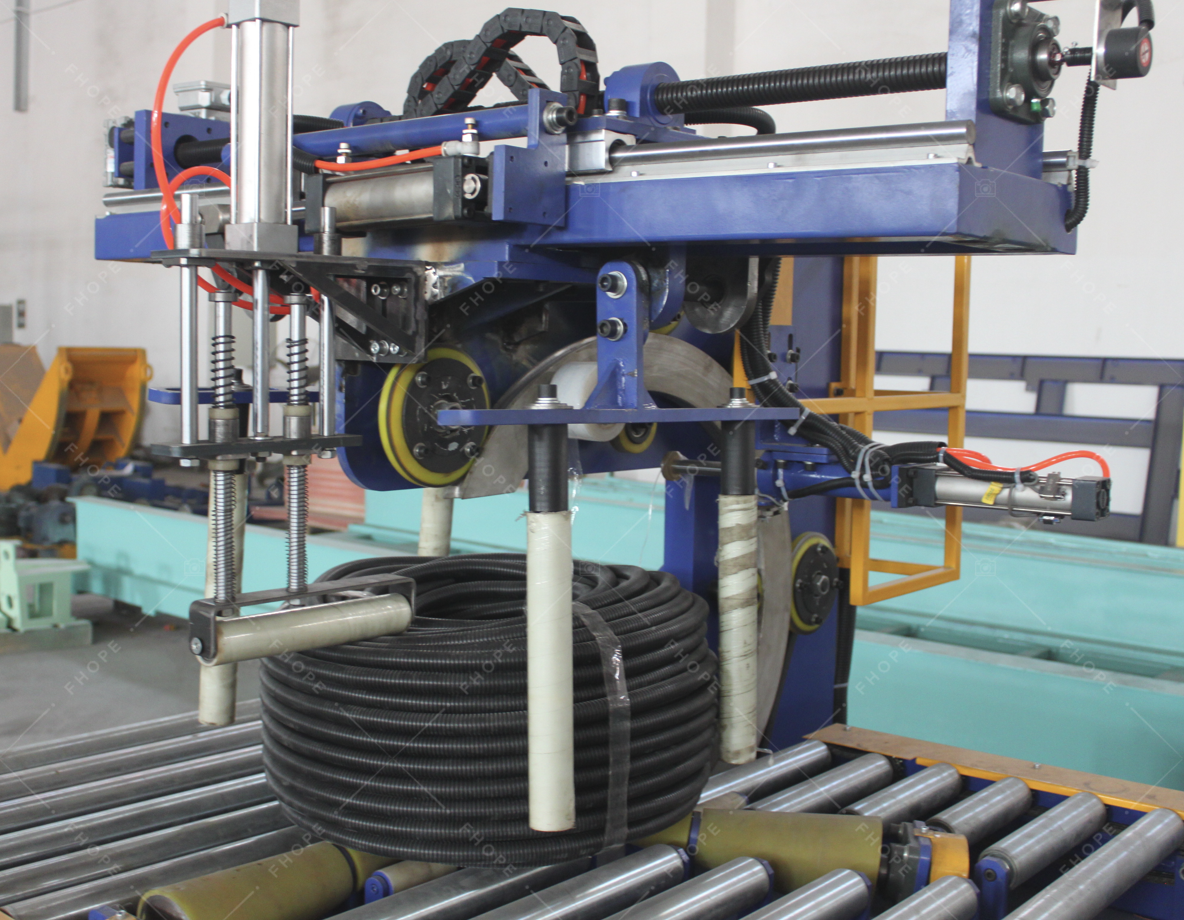
Hose Coil Packaging line
View Details →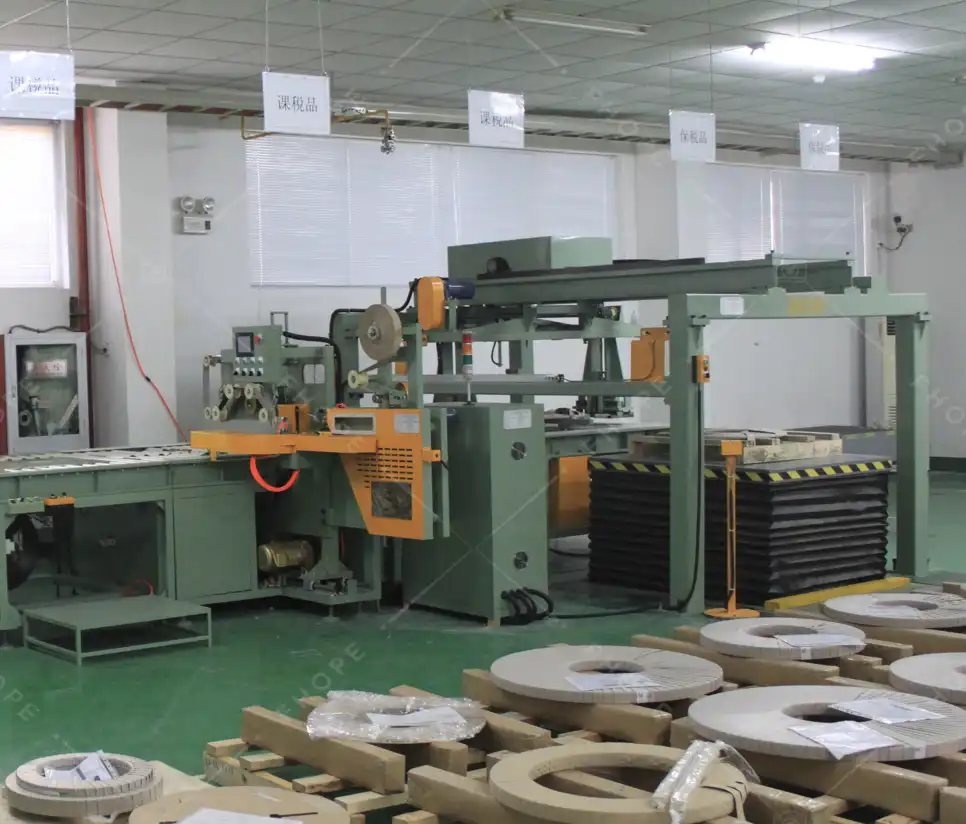
Copper Coil Packaging line
View Details →
Wire Coil Packaging line
View Details →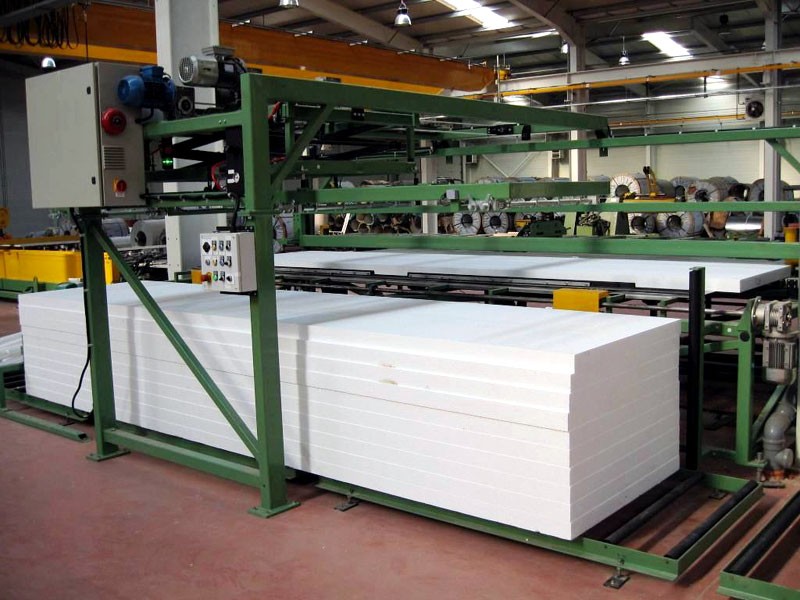
Panel Packaging line
View Details →
Pipe Bagging Machine
View Details →
Aluminum profile packing line
View Details →
FHOPE Automatic pipe tube bundling&strapping line
View Details →
Automatic pipe tube bundling & strapping line
View Details →
Automatic steel tube strapping machine
View Details →
FHOPE Automatic steel tube packing machine
View Details →
Automatic plastic Pipe strapping packing line
View Details →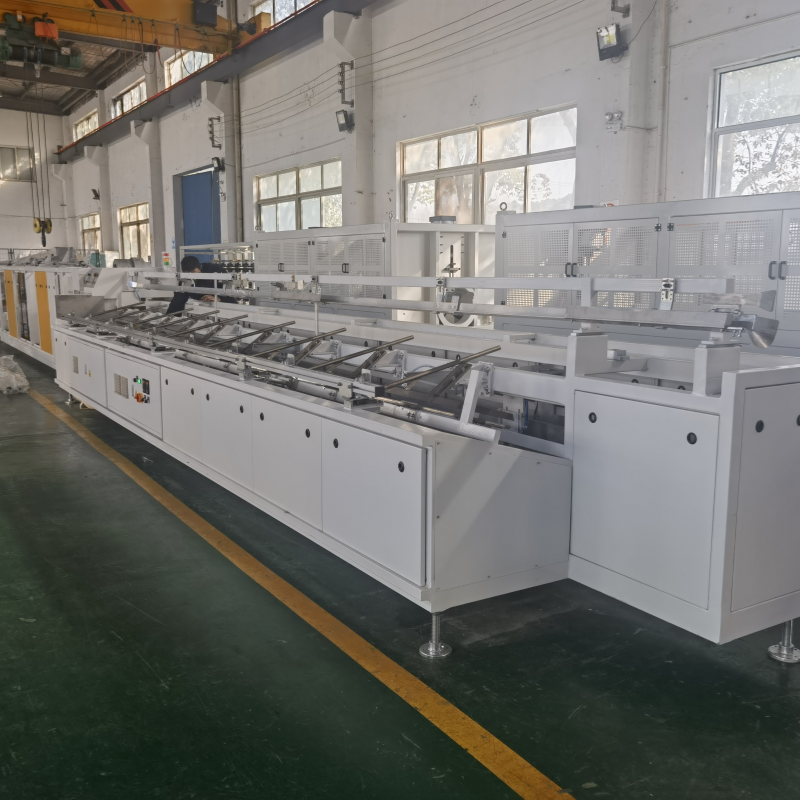
Automatic PPR/PVC Pipe bagging line
View Details →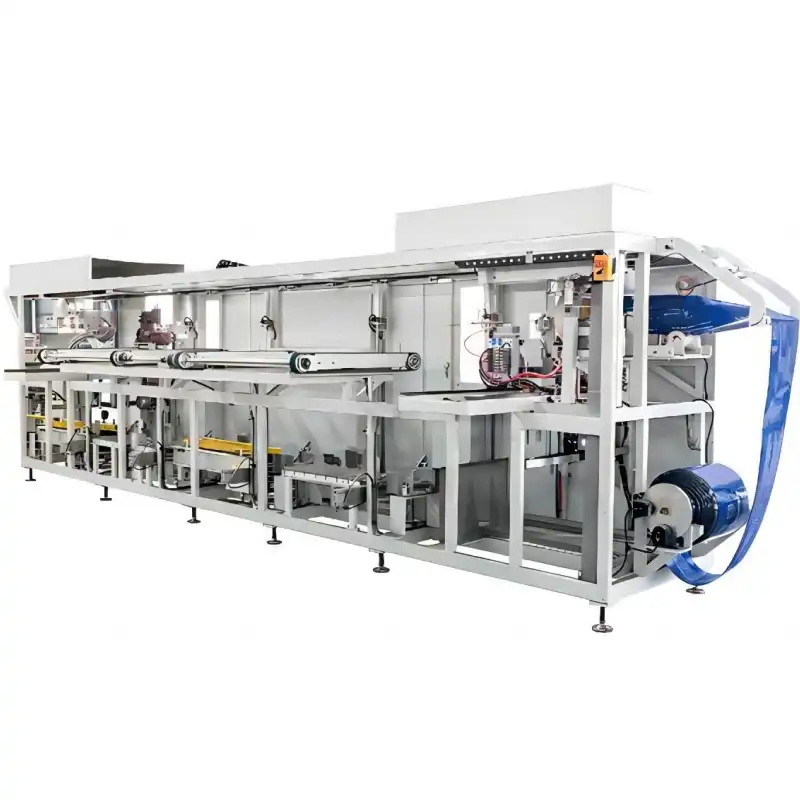
Platsic pipe bag packing machine
View Details →
Tyre Packing Machine FPT-200
View Details →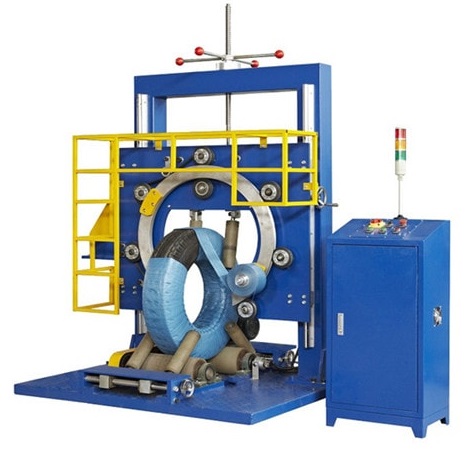
Tyre Packing Machine FPT-300
View Details →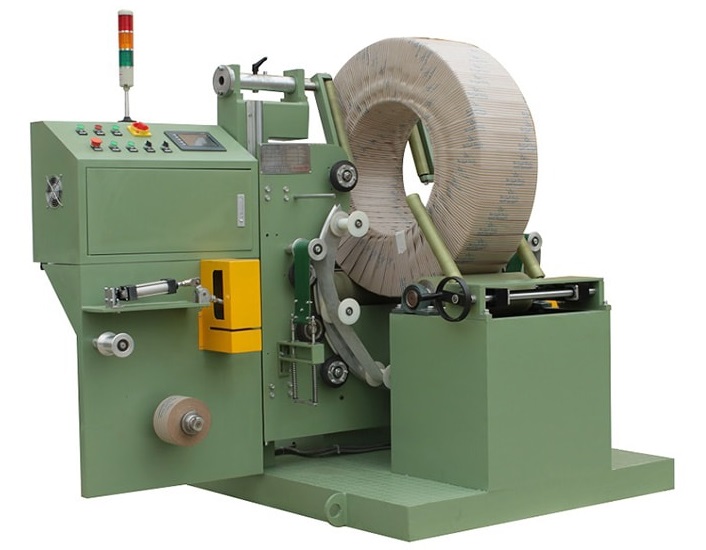
Tyre Packing Machine FPT-400
View Details →
Cable Coil Packing Machine-FPCA100
View Details →