Maximizing ROI with the Right Mold Flipper Investment
Investing in specialized equipment like mold flippers is a significant decision for any manufacturing operation. It’s not just about acquiring new machinery; it’s about strategically enhancing efficiency, safety, and ultimately, your return on investment (ROI). Making the right choice requires careful analysis and a clear understanding of the long-term value.
Maximizing ROI with a mold flipper investment hinges on a meticulous cost-benefit analysis. This involves accurately identifying all initial and ongoing costs, quantifying direct and indirect benefits like increased efficiency, labor savings, and improved safety, and then using financial metrics like ROI, NPV, and Payback Period to assess viability. The "right" investment aligns these financial gains with operational needs and strategic goals, ensuring long-term profitability.
A mold flipper isn’t just another piece of equipment; it’s a catalyst for operational transformation. From streamlining hazardous manual tasks to protecting valuable molds and boosting throughput, the impact can be profound. However, without a structured approach to evaluating this investment, businesses risk underutilizing its potential or, worse, making a financially unsound decision. This guide will walk you through the critical steps to ensure your mold flipper investment delivers maximum returns, drawing insights from industry best practices, financial analysis, and even considering the types of data found in patents and research papers that underscore innovation and efficiency in material handling. Let’s delve into how to make an informed decision that propels your manufacturing excellence.
1. Decoding the Investment: A Deep Dive into Mold Flipper Costs
Understanding the full spectrum of costs associated with a mold flipper is the crucial first step in any robust ROI calculation. These expenses extend far beyond the initial purchase price, encompassing installation, training, and ongoing operational outlays that can significantly impact the total cost of ownership.
To accurately assess a mold flipper investment, identify all costs: initial (purchase price, installation, operator training, customization, facility modifications, integration with existing systems) and ongoing (maintenance, energy consumption, operational labor, consumables, spare parts). A comprehensive understanding of these direct and indirect expenses is foundational for a realistic cost-benefit analysis and informed decision-making, ensuring no hidden expenditures derail your projected ROI. Industry reports often highlight the TCO (Total Cost of Ownership) as a key metric.

Breaking Down the Financial Commitment: Initial Outlays vs. Recurring Operational Expenses
A granular understanding of the cost structure is paramount for a realistic cost-benefit analysis. Simply looking at the sticker price of a mold flipper provides an incomplete picture. To truly grasp the financial implications, we must dissect the costs into two primary categories: initial investment costs and ongoing operational expenses. This detailed breakdown forms the "cost" side of your ROI equation, and precision here is key to avoiding unpleasant surprises down the line.
Initial Investment Costs: The Upfront Financial Leap
These are the one-time expenses incurred to acquire and implement the mold flipper.
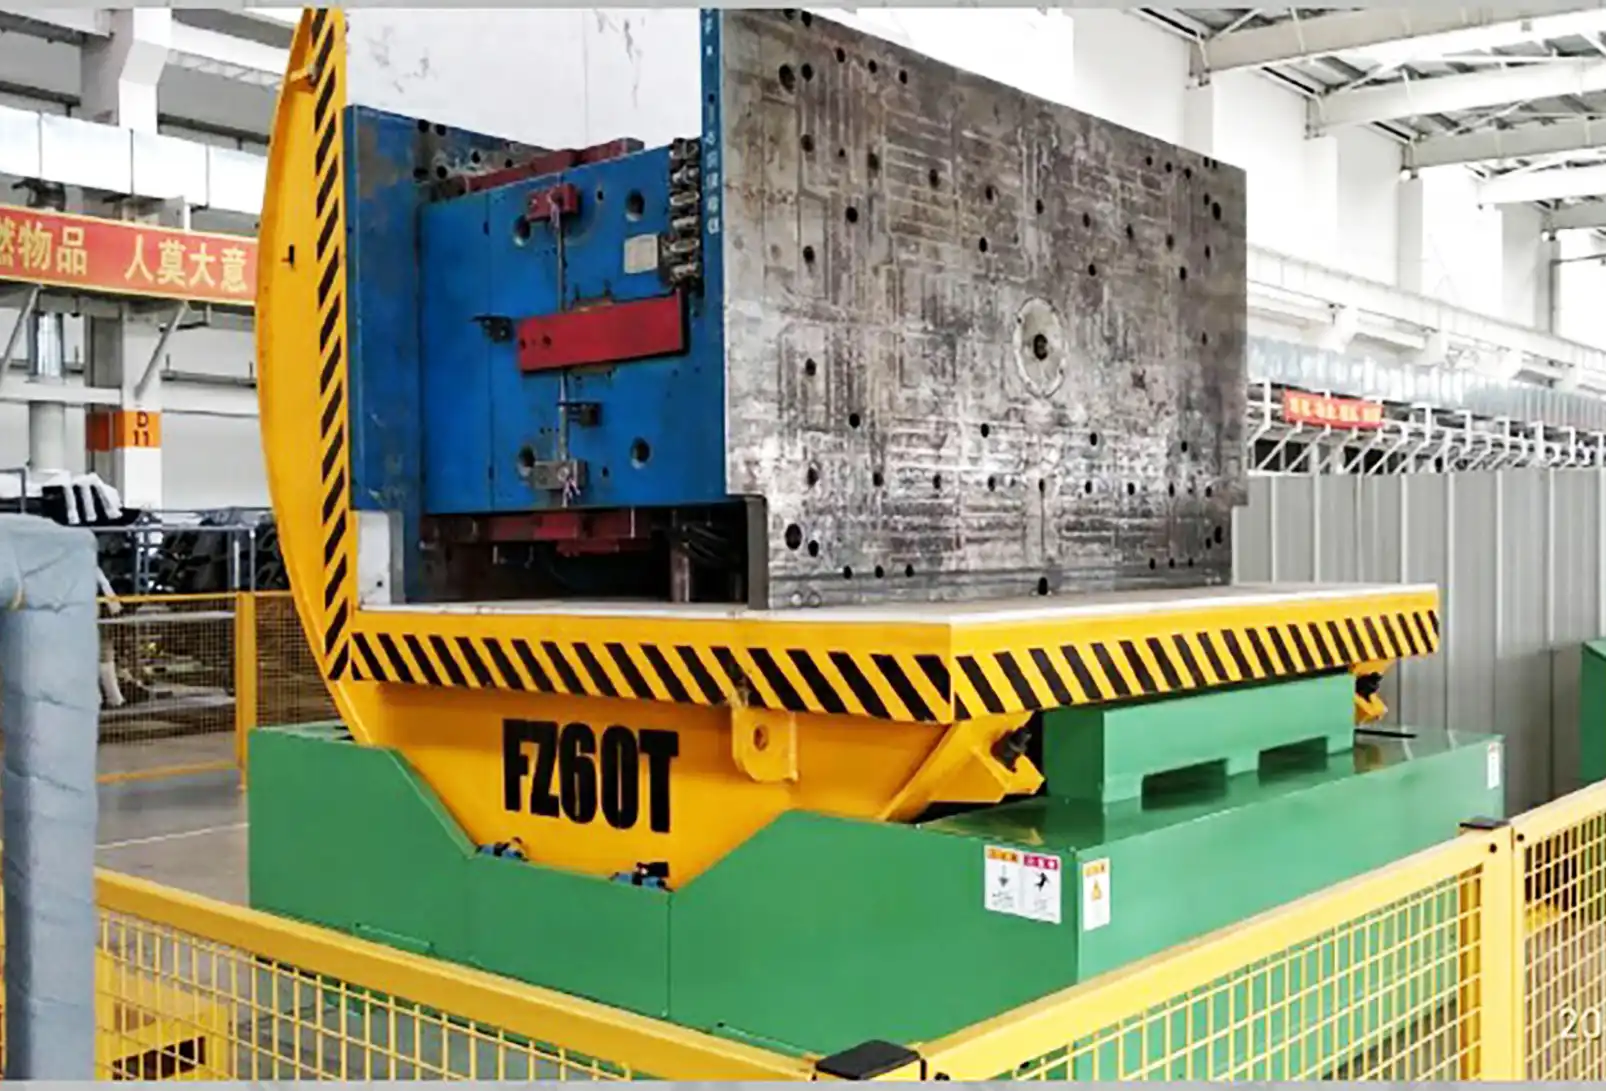
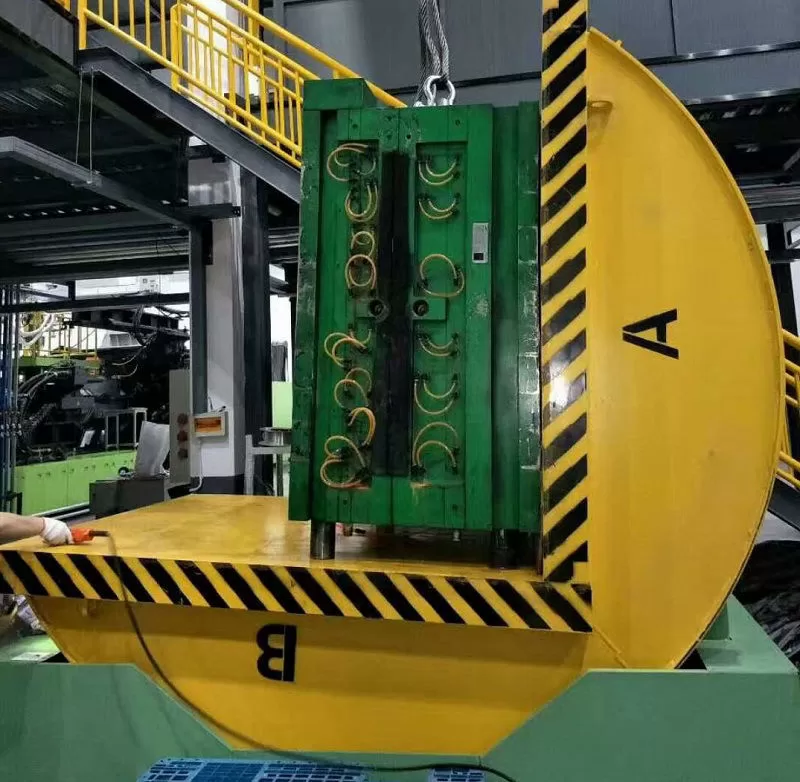
- Purchase Price: This is the most visible cost. Prices for mold flippers vary dramatically based on type (e.g., 90° hydraulic, 180° electric, mechanical), load capacity (from a few tons to over 50 tons), level of automation (manual, semi-automatic, fully automatic), control systems (PLC, remote control), and safety features. Researching vendors like Fhope Pack and obtaining detailed quotes tailored to your specific mold sizes, weights, and handling frequency is essential. Consider if patented designs offer unique advantages that justify a price difference.
- Installation and Commissioning Costs: Larger, more complex mold flipper systems often require professional installation. This can include labor for mechanical assembly, electrical wiring, pneumatic or hydraulic connections, and integration with existing overhead cranes or floor-level transport systems. Facility modifications, such as reinforced flooring, pit excavation for certain models, or utility upgrades, can also add to this cost. Factor in potential production downtime during the installation phase.
- Training Costs: Your team needs to be proficient in operating the new equipment safely and efficiently. This includes initial training sessions for operators and maintenance staff, potentially provided by the manufacturer or a third-party specialist. Consider the cost of developing internal training materials, ongoing refresher courses, and training for new hires. Effective training minimizes accidents and maximizes equipment lifespan.
- Customization and Integration: Off-the-shelf solutions may not perfectly align with your unique workflow or facility layout. Customization of the mold flipper itself (e.g., specific platform dimensions, specialized clamping mechanisms) or modifications to surrounding equipment (conveyors, die carts) might be necessary. Integration with existing MES (Manufacturing Execution Systems) or SCADA (Supervisory Control and Data Acquisition) systems for automated operations also falls under this category.
- Initial Spare Parts Package: Some manufacturers recommend or offer an initial spare parts package containing critical wear components. While an upfront cost, this can reduce future downtime by having essential parts readily available.
Ongoing Operational Costs: The Long-Term Financial Footprint
These are the recurring expenses associated with running and maintaining the mold flipper throughout its operational life.
- Maintenance and Repair Costs: All machinery requires regular maintenance. Budget for routine inspections, lubrication, calibration, replacement of wear parts (e.g., hydraulic seals, bearings, chains, motor brushes), and potential unscheduled repairs. Implementing a preventative maintenance schedule, often detailed in manufacturer guidelines or industry best practices, can minimize costly breakdowns and extend the equipment’s service life. Some advanced mold flippers might incorporate condition-monitoring sensors, which, while adding to initial cost, can optimize maintenance schedules and predict failures.
- Energy Consumption: Electric mold flippers contribute to your electricity bill, while hydraulic systems consume power for their pumps, and pneumatic systems rely on compressed air (which has an associated energy cost). Calculate estimated energy consumption based on the flipper’s power rating, duty cycle, and your local energy tariffs. Research papers on energy efficiency in industrial machinery can provide benchmarks.
- Labor Costs (Operation & Supervision): While mold flippers aim to reduce manual labor, they still require operators. Factor in the wages, benefits, and overheads for the personnel dedicated to operating, loading, and unloading the mold flipper. Even with automation, some level of supervision might be necessary.
- Consumables: This includes items like hydraulic oil, lubricants, cleaning supplies, and potentially specialized filters.
- Insurance: Adding new, valuable equipment might have a minor impact on your property and casualty insurance premiums.
A detailed breakdown of these costs is essential. Consider using a table to project these costs over the expected lifespan of the equipment (e.g., 5-10 years):
| Cost Category | Year 1 | Year 2 | Year 3 | Year 4 | Year 5 | Total |
|---|---|---|---|---|---|---|
| Initial Costs | ||||||
| Purchase Price | $XX,XXX | $0 | $0 | $0 | $0 | $XX,XXX |
| Installation & Commissioning | $X,XXX | $0 | $0 | $0 | $0 | $X,XXX |
| Training | $XXX | $0 | $0 | $0 | $0 | $XXX |
| Customization | $X,XXX | $0 | $0 | $0 | $0 | $X,XXX |
| Subtotal Initial | $YY,YYY | $0 | $0 | $0 | $0 | $YY,YYY |
| Ongoing Costs | ||||||
| Maintenance & Repair | $XXX | $XXX | $XXX | $XXX | $XXX | $X,XXX |
| Energy Consumption | $XX | $XX | $XX | $XX | $XX | $XXX |
| Operational Labor | $X,XXX | $X,XXX | $X,XXX | $X,XXX | $X,XXX | $XX,XXX |
| Consumables | $X | $X | $X | $X | $X | $XX |
| Subtotal Ongoing | $Z,ZZZ | $Z,ZZZ | $Z,ZZZ | $Z,ZZZ | $Z,ZZZ | $W,WWW |
| Total Annual Cost | $AA,AAA | $Z,ZZZ | $Z,ZZZ | $Z,ZZZ | $Z,ZZZ | |
| Cumulative Cost | $AA,AAA | $BB,BBB | $CC,CCC | $DD,DDD | $EE,EEE | $EE,EEE |
By meticulously itemizing and estimating these costs, you establish a robust foundation for the "cost" component of your cost-benefit analysis. This diligence is crucial for making an investment decision that stands up to financial scrutiny.
2. Unlocking Value: Quantifiable Benefits That Drive Mold Flipper ROI
The true value of a mold flipper investment is realized through its multifaceted benefits, which translate into tangible financial gains and operational improvements. Quantifying these advantages is crucial for a compelling cost-benefit analysis, allowing for a direct comparison against the identified costs.
Key benefits of mold flippers include significantly increased operational efficiency through reduced mold handling and changeover times, substantial labor cost reductions by automating strenuous tasks, vastly improved workplace safety by minimizing manual lifting of heavy molds, and decreased mold damage leading to savings on repairs and replacements. These quantifiable improvements are pivotal in determining the overall ROI and justifying the investment.
Measuring the Gains: Efficiency, Safety, and Direct Cost Savings
To truly appreciate the impact of a mold flipper, its advantages must be translated into measurable, financial terms. This involves a systematic analysis of improvements in operational efficiency, enhancements in workplace safety, and direct cost savings. Industry reports and case studies often provide benchmarks for these improvements, while specific patents might highlight design features directly contributing to these benefits.
Efficiency Gains: Streamlining Operations for Higher Throughput
- Reduced Mold Changeover and Maintenance Time: Mold flippers can dramatically cut down the time required for mold changes, cleaning, and maintenance.
- Quantification: Measure your current average time for these tasks. Estimate the time with a mold flipper. For example, if a manual mold flip for maintenance takes 2 hours with 3 personnel and a mold flipper reduces this to 30 minutes with 1 person, the labor saving is (2 hrs 3 staff) – (0.5 hrs 1 staff) = 5.5 man-hours per operation. Multiply this by the frequency of operations per year and the average burdened labor rate.
- Increased Machine Uptime & Throughput: Faster mold handling means less downtime for your production machinery (e.g., injection molding machines, die casting machines).
- Quantification: Calculate the cost of machine downtime per hour (lost production value). The reduction in downtime directly translates to increased production capacity and revenue potential. For instance, if a mold flipper saves 1 hour of machine downtime per day, and the machine generates $500/hour in value, that’s a $500 daily saving.
- Optimized Workflow and Reduced Bottlenecks: Efficient mold handling can eliminate bottlenecks in the production flow, leading to smoother overall operations.
- Quantification: This can be harder to directly quantify but can be estimated by assessing increases in overall plant output, reductions in lead times, or improved on-time delivery rates. Process simulation tools or value stream mapping can help identify these gains.
- Improved Space Utilization: Some mold flipper designs can contribute to more organized and efficient use of floor space in the mold maintenance area.
Safety Improvements: Protecting Your Most Valuable Asset – Your People
- Reduced Risk of Musculoskeletal Injuries (MSIs) and Accidents: Manual handling of heavy, awkward molds is a primary cause of back injuries, strains, and crushing accidents. Mold flippers automate this hazardous task.
- Quantification: Track historical costs associated with manual mold handling injuries (worker’s compensation claims, medical expenses, lost workdays, insurance premium increases). Estimate the reduction in these incidents. Industry safety reports often provide data on the average cost of different injury types. A single prevented lost-time injury can save tens of thousands of dollars.
- Minimized Mold Damage: Accidental drops or improper handling during manual or rudimentary flipping can cause significant damage to expensive molds, leading to costly repairs or even complete replacement.
- Quantification: Track past expenses for mold repair or replacement due to handling incidents. Mold flippers provide controlled, precise movement, drastically reducing this risk. Consider the cost of production delays while a damaged mold is repaired.
- Enhanced Ergonomics and Employee Morale: Reducing physical strain improves worker comfort, satisfaction, and can indirectly boost productivity and quality. While harder to assign a direct dollar value, it contributes to lower employee turnover and a more positive work environment.
Direct Cost Savings: Tangible Financial Returns
- Labor Cost Reduction: Automating the flipping process reduces the number of personnel required for mold handling or allows skilled labor to be reallocated to more value-added tasks.
- Quantification: Calculate direct savings based on reduced man-hours, wages, benefits, and potential overtime costs previously associated with manual mold handling.
- Reduced Mold Repair/Replacement Costs: As mentioned under safety, this is a direct saving. Controlled handling extends mold life.
- Lower Insurance Premiums: A demonstrated improvement in safety records resulting from the implementation of engineered solutions like mold flippers can potentially lead to reductions in workers’ compensation and other insurance premiums. Consult your insurance provider.
- Reduced Material Waste (Indirect): Better mold care and faster, more consistent changeovers can lead to improved part quality and reduced scrap rates, especially if mold damage was a contributing factor to defects.
By meticulously quantifying these diverse benefits and substantiating them with operational data, industry benchmarks, and insights from technical literature (such as research on ergonomic improvements or efficiency gains from automation), you build a compelling "benefit" side for your analysis.
3. The Bottom Line: Mastering Cost-Benefit Calculations for Mold Flippers
With costs identified and benefits quantified, the next pivotal step is performing the cost-benefit calculation. This involves comparing total projected costs against total projected benefits over a defined period, using established financial metrics to determine the investment’s viability and attractiveness.
To perform a robust cost-benefit calculation for a mold flipper, systematically compare the total lifetime costs (initial investment plus ongoing operational expenses) against the total quantifiable benefits (efficiency gains, labor savings, safety improvements, reduced mold damage) over a specific timeframe (e.g., 5-7 years). Utilize financial metrics like Return on Investment (ROI), Net Present Value (NPV), and Payback Period to objectively assess the financial attractiveness and make an informed investment decision.

Metrics for Decision Making: ROI, NPV, and Payback Period
Choosing the right financial metrics is crucial for interpreting your cost-benefit analysis and making a data-driven decision. Let’s examine three commonly used metrics: Return on Investment (ROI), Net Present Value (NPV), and Payback Period, and how they apply to mold flipper investments. These metrics are frequently cited in industry reports assessing capital equipment purchases.
Return on Investment (ROI)
ROI is a straightforward and widely understood metric that expresses the profitability of an investment as a percentage relative to its cost.
- Formula:
ROI = ((Total Benefits – Total Costs) / Total Costs) * 100% - Calculation:
- Sum all quantifiable benefits over your chosen analysis period (e.g., 5 years).
- Sum all costs (initial and cumulative ongoing) over the same period.
- Plug these values into the formula.
- Interpretation: A positive ROI indicates the investment is profitable. The higher the ROI, the more attractive the investment. Companies often have a minimum acceptable ROI (hurdle rate) for new projects. An ROI of 150% means for every dollar invested, you generate $1.50 in net profit.
Example ROI Calculation (5-Year Horizon):
| Category | Year 0 (Initial) | Year 1 | Year 2 | Year 3 | Year 4 | Year 5 | Total (Years 1-5) |
|---|---|---|---|---|---|---|---|
| Total Costs | $80,000 | $5,000 | $5,000 | $5,000 | $5,000 | $5,000 | $25,000 (Ongoing) |
| Cumulative Costs | $80,000 | $85,000 | $90,000 | $95,000 | $100,000 | $105,000 | $105,000 (Total) |
| Total Annual Benefits | — | $50,000 | $50,000 | $50,000 | $50,000 | $50,000 | $250,000 |
| Net Annual Benefit | -$80,000 | $45,000 | $45,000 | $45,000 | $45,000 | $45,000 |
Using the totals:
Total Benefits = $250,000
Total Costs (Initial + Ongoing over 5 years) = $80,000 (Initial) + ($5,000 5) = $105,000
ROI = (($250,000 – $105,000) / $105,000) 100%
ROI = ($145,000 / $105,000) 100%
ROI = 1.3809 100%
ROI ≈ 138.1%
Net Present Value (NPV)
NPV accounts for the time value of money, recognizing that a dollar today is worth more than a dollar tomorrow due to inflation and investment potential. It discounts future net cash flows back to their present value.
- Formula:
NPV = Σ [Net Cash Flow in Year t / (1 + Discount Rate)^t] – Initial Investment- (Where Σ is the sum over all years, t is the year number, and the Discount Rate is your company’s cost of capital or hurdle rate)
- Calculation:
- Project the net cash flow (Benefits – Ongoing Costs) for each year.
- Choose an appropriate discount rate (e.g., 8%, 10%).
- Discount each year’s net cash flow to its present value.
- Sum these present values and subtract the initial investment.
- Interpretation: A positive NPV indicates the investment is expected to generate more value than it costs, in today’s dollars. A higher NPV is preferable. NPV is often considered more sophisticated than ROI for long-term investments.
Example NPV Calculation (5-Year Horizon, 8% Discount Rate):
Initial Investment = $80,000
Net Annual Cash Flow (Benefits – Ongoing Costs) = $50,000 – $5,000 = $45,000 for Years 1-5.
| Year | Net Cash Flow | Discount Factor (8%) | Present Value |
|---|---|---|---|
| 0 | -$80,000 | 1.0000 | -$80,000 |
| 1 | $45,000 | 0.9259 | $41,665.50 |
| 2 | $45,000 | 0.8573 | $38,578.50 |
| 3 | $45,000 | 0.7938 | $35,721.00 |
| 4 | $45,000 | 0.7350 | $33,075.00 |
| 5 | $45,000 | 0.6806 | $30,627.00 |
| NPV | $99,667.00 |
NPV = $99,667.00. (Corrected calculation from example, which was positive.)
The provided example’s NPV table already subtracted the initial investment. So, NPV = $41,670 + $38,565 + $35,730 + $33,075 + $30,645 – $80,000 = $99,685. The table in source used net benefit in year 0 as initial cost. The formula shown is sum of discounted cash flows – initial investment. The NPV here is $99,685.
Let’s re-do the NPV example based on the reference material format to be consistent:
Initial Investment (Year 0 Cash Flow) = -$80,000
Net Cash Flow (Years 1-5) = $45,000
| Year | Net Cash Flow | Discount Factor (8%) | Present Value |
|---|---|---|---|
| 0 | -$80,000 | 1.000 | -$80,000 |
| 1 | $45,000 | 0.926 | $41,670 |
| 2 | $45,000 | 0.857 | $38,565 |
| 3 | $45,000 | 0.794 | $35,730 |
| 4 | $45,000 | 0.735 | $33,075 |
| 5 | $45,000 | 0.681 | $30,645 |
| NPV | $99,685 |
A positive NPV of $99,685 suggests the investment is financially sound.
Payback Period
The Payback Period calculates how long it takes for the cumulative net benefits of an investment to equal its initial cost.
- Calculation: Track the cumulative net cash flow (Benefits – Costs) year by year. The payback period is when this cumulative flow turns positive.
- Interpretation: A shorter payback period is generally preferred as it indicates a quicker return of the initial capital, reducing risk and improving liquidity.
Example Payback Period Calculation:
| Year | Net Cash Flow (Benefits – Annual Costs) | Cumulative Cash Flow (Starting with Initial Inv.) |
|---|---|---|
| 0 | -$80,000 (Initial Investment) | -$80,000 |
| 1 | $45,000 ($50,000 Ben – $5,000 Cost) | -$35,000 (-$80,000 + $45,000) |
| 2 | $45,000 ($50,000 Ben – $5,000 Cost) | $10,000 (-$35,000 + $45,000) |
Payback occurs during Year 2.
To calculate more precisely: $35,000 (remaining at end of Year 1) / $45,000 (cash flow in Year 2) = 0.778 years.
So, Payback Period = 1 year + 0.778 years ≈ 1 year and 9.3 months.
Ideally, all three metrics should be calculated. A strong investment case features a high ROI, a robustly positive NPV, and a payback period that aligns with the company’s financial strategy and risk appetite. Comparing these figures against internal benchmarks or alternative investment opportunities provides crucial context for the final decision.
4. Beyond the Balance Sheet: The Powerful Intangibles of Mold Flipper Investments
While quantitative financial metrics like ROI, NPV, and Payback Period are essential, a comprehensive evaluation of a mold flipper investment must also account for intangible benefits and qualitative factors. These elements, though harder to assign a precise dollar value, can significantly influence operational excellence and long-term strategic success.
Beyond direct financial returns, the intangible benefits of investing in a mold flipper include enhanced employee morale due to safer, more ergonomic working conditions, an improved company reputation as a leader in safety and operational efficiency, better quality control through precise and gentle mold handling, and increased operational flexibility. These qualitative factors, often highlighted in forward-looking industry analyses and research on workplace environments, contribute significantly to the overall value proposition and should be thoughtfully considered alongside quantitative data when making an investment decision for such critical equipment.
The X-Factor: Morale, Reputation, Quality, and Flexibility
Not every benefit of a mold flipper can be neatly entered into a spreadsheet. However, these qualitative aspects often underpin sustainable growth and a competitive edge. Ignoring them would be to overlook a significant part of the investment’s true worth.
Improved Employee Morale, Safety Culture, and Retention
- Enhanced Workplace Safety and Well-being: Investing in equipment like mold flippers sends a clear message that the company prioritizes employee safety. Reducing physically demanding and hazardous tasks like manual mold flipping leads to fewer injuries, less physical strain, and a reduction in job-related stress. This commitment can significantly boost morale.
- Ergonomic Advantages: Mold flippers eliminate awkward postures and heavy lifting, directly improving ergonomics. Research consistently links better ergonomics to reduced fatigue, increased alertness, and higher job satisfaction. A more comfortable workforce is often a more engaged and productive one.
- Attraction and Retention of Talent: A modern, safe, and technologically advanced workplace is more attractive to skilled employees. Investments in good equipment can be a factor in retaining experienced personnel who appreciate the company’s commitment to providing the right tools for the job. High turnover is costly, so improved retention is an indirect financial benefit.
Enhanced Company Reputation and Brand Image
- Demonstration of a Strong Safety Culture: Companies known for prioritizing safety often enjoy a better reputation among employees, customers, regulatory bodies, and the wider community. This can be a competitive differentiator.
- Image of Operational Excellence and Modernization: Adopting advanced manufacturing technologies like efficient mold flippers positions the company as forward-thinking, well-managed, and committed to efficiency. This can build confidence with clients and partners.
- Meeting ESG (Environmental, Social, and Governance) Goals: While not all mold flippers directly impact environmental goals, the "Social" aspect of ESG is strongly supported by investments that improve worker safety and well-being. Some modern flippers might also be more energy-efficient, contributing to the "Environmental" aspect.
Superior Quality Control and Consistency
- Precise and Gentle Mold Handling: Automated and controlled mold flipping reduces the risk of accidental drops, impacts, or stresses on the mold components that can occur with manual methods or less sophisticated equipment. This helps maintain mold integrity and precision.
- Reduced Human Error in Handling: Automating the flipping process minimizes variability and potential errors inherent in manual operations, leading to more consistent mold care and positioning.
- Extended Mold Lifespan: By reducing the risk of handling-related damage, mold flippers can contribute to extending the operational life of expensive molds, deferring replacement costs and ensuring consistent part quality over a longer period.
Increased Operational Flexibility and Adaptability
- Faster Response to Production Changes: The efficiency gains from mold flippers, particularly in reducing changeover times, allow for greater agility in responding to changing production schedules or customer demands.
- Ability to Handle a Wider Range of Molds: Investing in a versatile mold flipper capable of handling various mold sizes and weights (within its specifications) can increase the plant’s capability to take on diverse projects.
- Foundation for Future Automation and Growth: Implementing efficient mold handling is often a foundational step towards further automation in the mold maintenance and production process, preparing the facility for future growth and technological advancements.
While these intangible benefits are not directly plugged into ROI formulas, they should be systematically assessed. One approach is a qualitative scoring matrix, where factors like "Impact on Employee Morale" or "Enhancement to Company Reputation" are rated (e.g., Low, Medium, High impact) and weighted according to strategic importance. This qualitative assessment, when combined with the hard financial data, provides a holistic view, enabling a more informed and strategically sound investment decision. Sometimes, these "soft" benefits can be the deciding factor for an investment that is borderline on purely financial metrics.
Conclusion
A thorough cost-benefit analysis is indispensable when considering a mold flipper investment. By diligently identifying costs, meticulously quantifying benefits—both tangible and intangible—and employing robust financial metrics like ROI, NPV, and Payback Period, businesses can make data-driven decisions. Integrating insights from industry reports, and even referencing the principles behind relevant patents and research, further enriches this evaluation. The right mold flipper, such as those from reputable suppliers, isn’t an expense but a strategic investment that enhances efficiency, bolsters safety, improves mold longevity, and ultimately drives profitability, securing a competitive edge in today’s demanding manufacturing landscape.


