
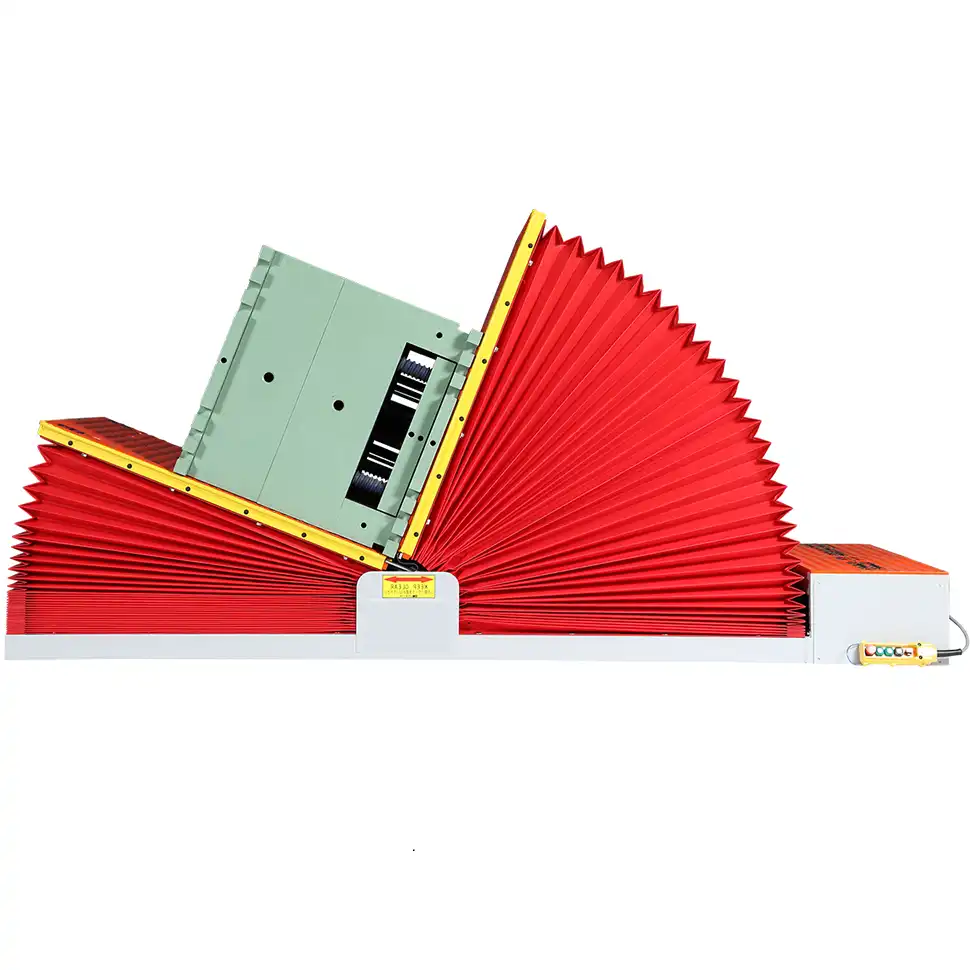
How Can You Justify Buying a Mold Upender to Your Finance Department?
Struggling to get budget approval for essential equipment? Manual mold handling is slow, dangerous, and potentially costly, yet finance scrutinizes every capital expenditure. You know a mold upender improves safety and efficiency, but how do you convince the number crunchers? This guide provides the framework.


Justify buying a mold upender by presenting a compelling business case focusing on Return on Investment (ROI) and Cost-Benefit Analysis (CBA). Quantify safety improvements (reduced injury costs), efficiency gains (faster changeovers, less downtime), and potential damage reduction to molds. Frame it as a strategic investment, not just an expense, demonstrating clear financial payback and operational advantages that align with company goals and overcome the initial cost hurdle.
Convincing your finance department requires more than just stating the operational need; it demands a data-driven justification presented in terms they understand – dollars and sense. Moving forward, we’ll dissect how to build this financial argument step-by-step, turning your equipment request into an irresistible investment proposal.
Building Your Business Case: Beyond the Basics
Securing capital for equipment like a mold upender can feel like navigating a maze blindfolded. Your operations team sees the clear benefits, but the finance department requires a robust business case. It’s not enough to say it’s needed; you must demonstrate why it’s a sound financial decision for the company.
Building a robust business case involves clearly defining the problem the mold upender solves (e.g., safety hazards from manual flipping, inefficiencies in changeover times) and aligning the solution with strategic business objectives like improved safety metrics, increased production uptime, or reduced operational expenditures. It requires meticulous identification and quantification of both the initial investment costs (purchase price, installation, operator training) and the projected benefits (tangible savings like reduced labor and damage, intangible improvements like enhanced worker safety and morale). This structured approach transforms a simple equipment request into a strategic investment proposal backed by verifiable data, significantly boosting its chances of receiving financial approval.

Identifying Costs vs. Benefits: The Core Analysis
The foundation of your justification lies in a thorough Cost-Benefit Analysis (CBA). This isn’t just about the sticker price; it encompasses all financial implications over the asset’s lifecycle. Finance needs to see a clear picture of what the company spends versus what it gains.
Understanding the Costs:
Be comprehensive when listing costs. Overlooking items can undermine your credibility.
- Direct Costs:
- Purchase Price: The quoted cost from the vendor.
- Installation & Commissioning: Costs associated with site preparation (e.g., floor reinforcement, electrical work), delivery, setup, and testing.
- Initial Training: Ensuring operators and maintenance staff can use and care for the equipment safely and effectively.
- Indirect Costs (Ongoing):
- Maintenance: Scheduled preventative maintenance, potential repairs, spare parts inventory.
- Operating Costs: Energy consumption, consumables (lubricants, etc.).
- Potential Downtime: While the goal is to reduce downtime, factor in scheduled maintenance periods.
- Intangible Costs (Consider if applicable):
- Disruption during Installation: Minor productivity impacts during the setup phase.
Quantifying the Benefits:
This is where you demonstrate the value proposition. Benefits can be tangible (easily measured in dollars) or intangible (harder to quantify but still valuable).
- Tangible Benefits:
- Reduced Labor Costs: Time saved during mold handling/flipping translates directly to lower labor expenses per cycle or changeover. Calculate this based on time saved and loaded labor rates.
- Increased Production Uptime: Faster, safer mold changes mean less time the primary production machinery (e.g., injection molding machine, press) is idle. Calculate the value of this additional production time.
- Reduced Mold Damage: Manual handling increases the risk of dropping or damaging expensive molds. Estimate the cost savings from avoided repairs or replacements.
- Lower Injury-Related Costs: This is often the most compelling argument. Calculate savings from avoided medical expenses, workers’ compensation claims, lost workdays, insurance premium increases, and potential regulatory fines (e.g., OSHA).
- Intangible Benefits (Assign estimated value where possible):
- Improved Worker Safety & Morale: Reduced physical strain and risk lead to a safer work environment and can improve employee retention. While hard to price, it contributes to long-term stability.
- Enhanced Process Control & Repeatability: Mechanical handling is more consistent than manual methods.
- Improved Company Image/Compliance: Demonstrating commitment to safety standards.
Structuring the CBA:
Present the data clearly. A table summarizing costs and benefits over a specific period (e.g., 3-5 years) is highly effective.
Example Cost Breakdown Table:
| Cost Category | Year 0 ($) | Year 1 ($) | Year 2 ($) | Year 3 ($) | Total ($) |
|---|---|---|---|---|---|
| Purchase Price | 50,000 | 0 | 0 | 0 | 50,000 |
| Installation & Setup | 5,000 | 0 | 0 | 0 | 5,000 |
| Initial Training | 2,000 | 0 | 0 | 0 | 2,000 |
| Annual Maintenance | 0 | 1,000 | 1,000 | 1,000 | 3,000 |
| Annual Operating (Est.) | 0 | 1,500 | 1,500 | 1,500 | 4,500 |
| Total Costs | 57,000 | 2,500 | 2,500 | 2,500 | 64,500 |
Remember to clearly state your assumptions for each cost and benefit calculation. Transparency is key when presenting to finance.
Crunching the Numbers: ROI and Payback Period
Listing costs and benefits is essential, but finance professionals need specific metrics to evaluate an investment’s attractiveness. Return on Investment (ROI) and Payback Period are fundamental calculations that translate your operational improvements into the financial language decision-makers understand. They quantify the profitability and speed of return.
Calculate the ROI by dividing the net benefits (total benefits minus total costs over a period) by the total cost of the investment. A positive ROI signals profitability. The Payback Period reveals how quickly the initial investment cost is recovered through the accumulated savings and operational gains generated by the mold upender. Presenting these key metrics provides clear, quantifiable evidence of the project’s financial viability.

Calculating Key Financial Metrics
Let’s break down how to calculate these crucial figures using the data gathered in your Cost-Benefit Analysis.
Return on Investment (ROI):
ROI measures the efficiency or profitability of an investment. It’s expressed as a percentage. The basic formula is:
ROI = (Net Benefits / Total Cost of Investment) x 100
Where:
- Net Benefits = Total Benefits – Total Costs (calculated over a specific period, e.g., 3 or 5 years)
- Total Cost of Investment = Typically the initial investment (Year 0 costs), but sometimes the total lifecycle cost is used depending on the finance department’s preference. Be clear which you are using.
Example Calculation (using 3-year data from hypothetical tables):
Assume Total Benefits over 3 years = $150,000 (e.g., $50,000/year as per the Benefits table example later)
Assume Total Costs over 3 years = $64,500 (from the Cost Breakdown table)
Assume Initial Investment Cost (Year 0) = $57,000
- Net Benefits (3 years) = $150,000 – $64,500 = $85,500
- ROI (based on initial cost) = ($85,500 / $57,000) x 100 = 150%
- ROI (based on total 3-year cost) = ($85,500 / $64,500) x 100 = 132.6%
A positive ROI like this is a strong indicator of a good investment. Clearly state the timeframe used for your calculation.
Payback Period:
This metric tells finance how long it will take for the investment to generate enough savings or revenue to cover its initial cost. A shorter payback period is generally preferred as it reduces risk.
The simple formula is:
Payback Period = Initial Investment Cost / Annual Net Cash Flow (or Savings)
Where:
- Initial Investment Cost = Year 0 costs ($57,000 in our example)
- Annual Net Cash Flow (or Savings) = Annual Benefits – Annual Operating/Maintenance Costs
Example Calculation:
Assume Annual Benefits = $50,000
Assume Annual Operating/Maintenance Costs = $2,500 (Year 1 onwards from Cost table)
Annual Net Cash Flow = $50,000 – $2,500 = $47,500
Payback Period = $57,000 / $47,500 = 1.2 years
This means the initial investment is expected to be paid back in just over a year through the benefits generated.
Net Present Value (NPV): A More Sophisticated View
For larger investments or longer timeframes, finance may want to see the Net Present Value (NPV). NPV accounts for the time value of money – the principle that a dollar today is worth more than a dollar tomorrow due to inflation and potential earning capacity. It discounts future cash flows back to their present value.
The formula is complex: NPV = Σ [ (Bt – Ct) / (1 + r)^t ] for t = 0 to n
Where B=Benefits, C=Costs, r=discount rate, t=time period, n=number of periods.
A positive NPV indicates that the projected earnings generated by a project (in present dollar terms) exceed the anticipated costs (also in present dollar terms). Generally, a positive NPV is favorable. You may need assistance from your finance department to determine the appropriate discount rate (often related to the company’s cost of capital). While more complex, presenting an NPV calculation demonstrates a deeper level of financial understanding.
Quantifying the "Soft" Stuff: Safety and Efficiency Gains
Problem: Manual mold handling is notoriously risky, leading to potential injuries and slowing down critical changeover processes. Agitation: Finance departments often struggle to value "soft" benefits like improved safety, viewing them as intangible and hard to measure. Solution: This section details how to translate these crucial operational improvements into concrete financial figures.
Quantify safety improvements by estimating the direct and indirect costs of potential injuries (medical treatment, lost work time, insurance premium increases, potential regulatory fines) that are avoided by implementing a mold upender. Calculate efficiency gains by meticulously measuring the reduction in changeover times, decreased manual labor required per flip, and the resulting increase in valuable production machine uptime. These translate directly into demonstrable cost savings and increased output potential.


Monetizing Operational Improvements
Turning operational advantages into numbers finance can appreciate is crucial. It involves careful estimation based on historical data, industry benchmarks, and reasonable assumptions.
Quantifying Safety Benefits:
Injuries are expensive. Avoiding them offers significant savings.
- Direct Medical Costs: Research average costs for common handling injuries (e.g., back strains, crushed fingers/toes) in your region or industry. Even avoiding one moderate injury can save tens of thousands.
- Lost Workdays: Calculate the cost of wages paid for time off due to injury, plus the cost of temporary replacements or lost productivity.
- Workers’ Compensation: Factor in potential increases in insurance premiums following a claim. Your HR or insurance provider might offer data.
- Indirect Costs: Consider time spent on incident investigation, reporting, potential legal fees, and damage to employee morale.
- OSHA/Regulatory Fines: Severe or repeated safety violations can lead to substantial penalties. Preventing these has direct financial value.
Estimation Example: If the average cost of a lost-time back injury is $40,000 (including medical, lost wages, insurance impact), and implementing the mold upender reduces the probability of such an injury from, say, 5% per year to near 0%, the expected annual safety saving is 0.05 * $40,000 = $2,000, plus potentially more from avoiding minor incidents or near misses. Use conservative estimates but demonstrate the potential scale.
Quantifying Efficiency Gains:
Time is money, especially in manufacturing.
- Reduced Changeover Time:
- Measure the current average time taken for manual mold flipping/handling during a changeover.
- Estimate the time required using the mold upender (vendor data or time studies on similar equipment can help).
- Calculate Time Saved per Changeover = Manual Time – Upender Time.
- Annual Time Savings = (Time Saved per Changeover) x (Number of Changeovers per Year).
- Annual Labor Cost Savings = (Annual Time Savings) x (Loaded Hourly Labor Rate of involved personnel).
- Increased Machine Uptime:
- The time saved during changeovers directly translates to increased availability of the primary production machine (e.g., injection molding press).
- Calculate the Value of Increased Uptime = (Annual Time Savings from faster changeovers) x (Value per Hour of the production machine running – e.g., profit generated or standard cost rate). This can be a very significant number if the machine is a bottleneck.
- Reduced Mold Damage:
- Track historical costs associated with mold damage during manual handling (repairs, replacements).
- Estimate the reduction in these incidents due to the controlled handling provided by the upender.
- Annual Savings = Estimated Reduction Percentage x Historical Annual Damage Cost.
Presenting Quantified Benefits:
Use a table to clearly show how you arrived at the annual benefit figures.
| Benefit Category | Annual Estimate ($) | Calculation Basis & Assumptions |
|---|---|---|
| Reduced Injury Costs | 15,000 | Avoided expected cost of 1 minor ($5k) & 0.25 major ($40k) injuries based on historical rates & avg. costs. Conservative. |
| Labor Savings (Changeovers) | 10,400 | (0.5 hr saved/changeover) (4 changeovers/week) (52 weeks) * ($100/hr avg. loaded labor for 2 pers.) |
| Increased Production Uptime | 20,800 | (0.5 hr saved/changeover) (4 changeovers/week) (52 weeks) * ($200/hr machine contribution margin) |
| Reduced Mold Damage | 5,000 | Estimated 75% reduction in $6,700 historical annual repair costs due to handling incidents. |
| Total Quantified Annual Benefits | 51,200 | These figures form the basis for ROI and Payback calculations. |
Be prepared to defend your assumptions, but showing the methodology adds significant weight to your business case.
Presenting Your Case: Addressing Finance’s Concerns
You’ve meticulously gathered data, performed the calculations, and quantified the benefits. The final hurdle is presenting this information effectively to your finance department. This isn’t just about showing the numbers; it’s about building confidence, addressing potential skepticism, and framing the purchase as a strategically sound investment.


Present your justification clearly and concisely, leading with the executive summary and key financial metrics (ROI, Payback Period, potentially NPV). Highlight the assumptions made in your calculations and be transparent about potential risks. Frame the mold upender acquisition not merely as a piece of machinery but as a direct solution to specific, costly business problems (safety incidents, production bottlenecks, high labor costs) with a strong, demonstrable financial return that aligns with broader company objectives. This approach directly addresses the core concerns of financial decision-makers: value, risk, and strategic alignment.
Tailoring Your Pitch for the Finance Audience
Finance professionals prioritize data, risk management, and alignment with financial goals. Tailor your presentation accordingly:
- Lead with the Bottom Line: Start with an executive summary that highlights the key financial takeaways – the positive ROI, the short Payback Period, and the core problem being solved. Get straight to the point.
- Focus on Financial Metrics: While operational benefits are important, emphasize the ROI, Payback Period, and NPV. These are the metrics they use daily to evaluate proposals. Use clear charts and graphs to visualize these results.
- Transparency is Crucial: Clearly state all assumptions used in your cost and benefit calculations. Acknowledge where estimates were made and the basis for them (e.g., historical data, vendor quotes, industry benchmarks). This builds trust.
- Anticipate Questions and Concerns: Put yourself in their shoes. What would you ask?
- Alternatives: "Have you considered other options? Why is this the best one?" (Be ready to briefly discuss alternatives like cranes or forklifts with specialized attachments and why the upender is superior for this specific task in terms of safety, efficiency, or footprint).
- Risk: "What if the savings aren’t realized? What are the biggest risks associated with this investment?" (Address risks like lower-than-expected utilization, higher maintenance costs, or changes in production needs. Discuss mitigation strategies).
- Necessity: "Is this a ‘nice-to-have’ or a ‘need-to-have’?" (Frame it as a need based on quantifiable safety risks and efficiency losses impacting the bottom line).
- Assumptions: "How confident are you in these benefit estimations?" (Refer back to your data sources and state confidence levels, perhaps showing a sensitivity analysis – best case, worst case, most likely case ROI).
- Highlight Strategic Alignment: Connect the purchase to larger company goals. Does it support a "safety-first" culture? Does it improve throughput for a key product line? Does it reduce operational costs in line with budget targets? Showing this alignment elevates the request from operational convenience to strategic necessity.
- Structure Your Presentation Logically:
- Executive Summary: Key findings and recommendation.
- Problem Statement: Clearly define the issues with the current method (safety, inefficiency, costs).
- Proposed Solution: Introduce the mold upender and its function.
- Cost-Benefit Analysis: Detailed breakdown of costs and quantified benefits (use summary tables).
- Financial Metrics: Clearly present ROI, Payback Period, NPV calculations and results.
- Risk Assessment & Mitigation: Address potential downsides and how they’ll be managed.
- Conclusion & Recommendation: Reiterate the financial justification and formally request approval.
- Keep it Concise: While your backup data should be thorough, the presentation itself should be clear, concise, and focused on the key decision-making factors. Avoid overly technical jargon.
By presenting a well-researched, data-driven case tailored to the financial perspective, you significantly increase the probability of getting that crucial "yes" for your mold upender.
Conclusion
Successfully justifying the purchase of a mold upender hinges on translating operational needs into a compelling financial argument. By meticulously conducting a Cost-Benefit Analysis, quantifying tangible benefits like reduced labor costs and avoided injuries, and calculating key metrics such as ROI and Payback Period, you provide the concrete data finance requires. Presenting this information clearly, addressing potential risks, and aligning the investment with strategic company goals transforms the request from a simple expense into a value-generating proposition. A strong Financial justification, supported by robust data and clear communication, is paramount to securing approval for crucial equipment like a mold upender, ultimately improving safety, efficiency, and the company’s bottom line.


