Assessing the Financial Impact of Mold Flipper Integration
Integrating mold flippers into manufacturing operations represents a significant capital investment. Therefore, a meticulous assessment of its financial impact is paramount for informed decision-making. This evaluation ensures that the benefits outweigh the costs, aligning the investment with strategic operational and financial objectives, ultimately driving enhanced productivity and profitability.

Assessing the financial impact of mold flipper integration involves a comprehensive cost-benefit analysis, weighing initial and ongoing expenses against quantifiable gains like increased efficiency, reduced labor, improved safety, and decreased mold damage. This analysis determines the Return on Investment (ROI), Net Present Value (NPV), and Payback Period, offering a clear financial rationale for the investment and its contribution to operational excellence and profitability.
Investing in new equipment such as a mold flipper is a strategic decision that necessitates careful financial scrutiny. Understanding the full spectrum of costs and benefits, both tangible and intangible, allows businesses to project the long-term financial implications accurately. This article delves into the methodologies for conducting such an assessment, empowering manufacturers to make data-driven choices that optimize resources and enhance competitive advantage.
1. Identifying Costs Associated with Mold Flipper Integration
To accurately assess the financial viability of mold flipper integration, a comprehensive identification of all associated costs is essential. These expenditures span initial procurement and setup to long-term operational and maintenance outlays, forming the crucial "cost" side of the cost-benefit equation for any manufacturing enterprise.
The primary costs associated with mold flipper integration are categorized into initial investment costs—including purchase price, installation, operator training, and potential facility modifications or customization—and ongoing operational costs, which encompass maintenance, energy consumption, operational labor, and consumables like spare parts or lubricants. Accurately identifying and quantifying these diverse expenses is fundamental to a thorough financial impact assessment, ensuring all financial commitments are considered before investment.
Breaking Down the Investment: A Deeper Dive into Initial and Operational Expenditures
A granular understanding of the cost structure is vital for a realistic financial impact assessment. This involves dissecting the total investment into its constituent parts: upfront initial costs and recurring operational expenses. This detailed breakdown provides a clear and comprehensive view of the financial commitment involved in integrating mold flipper technology. High initial capital investment is a significant barrier to entry for new participants in the Mold Flippers Market, with advanced machinery often costing hundreds of thousands of dollars.
Initial Investment Costs:
These are the one-time expenses incurred at the outset of the project.
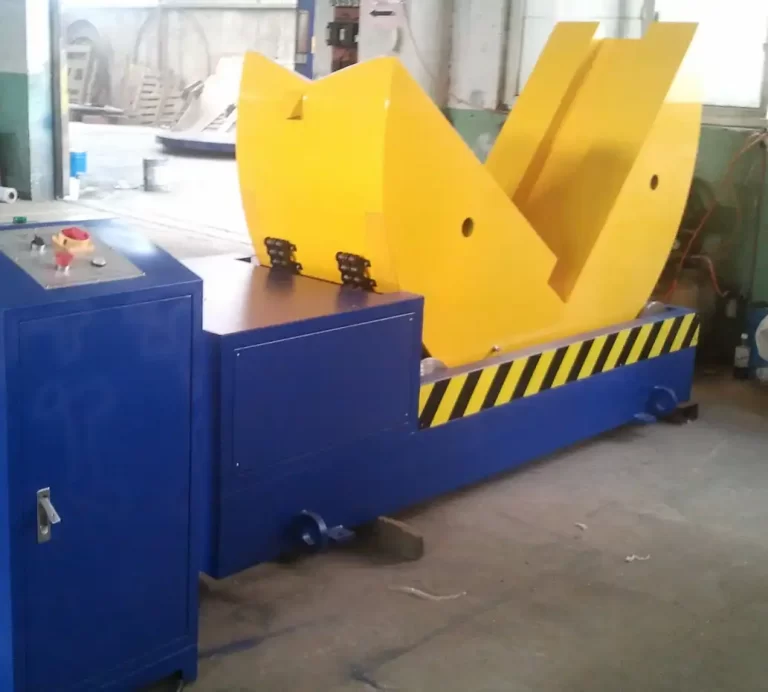
- Purchase Price: This is the most direct and often largest component of the initial investment. Prices for mold flippers vary significantly based on type (e.g., 90-degree, 180-degree), load capacity (ranging from a few tons to over 50 tons), level of automation (manual, semi-automatic, fully automatic), and the manufacturer. For instance, basic models might start from $10,000, while large, custom-automated systems can exceed $100,000. It’s crucial to obtain quotes from reputable vendors, like Fhope Pack, tailored to specific operational needs.
- Installation Costs: Larger and more complex mold flipper systems, especially those integrated into automated production lines, often require professional installation. These costs include labor for mechanical and electrical setup, any necessary modifications to the factory floor (e.g., reinforced concrete pads, pits), and connections to power (electrical) or compressed air (pneumatic) supplies. Potential production downtime during the installation phase should also be factored in as an indirect cost. Installation might range from $1,000 for simpler units to over $15,000 for complex integrations.
- Training Costs: Operators and maintenance staff must be adequately trained to use and maintain the new equipment safely and efficiently. This includes initial training sessions provided by the vendor and potentially ongoing or refresher training for new hires or when advanced features are implemented. Costs can vary depending on whether training is conducted on-site or at the vendor’s facility, and the number of personnel to be trained. Budgeting $500 to $5,000 for comprehensive training is a reasonable estimate.
- Customization and Integration Costs: If standard mold flipper models do not perfectly align with existing workflows or facility layouts, customization may be necessary. This could involve modifications to the flipper itself, such as specialized fixtures or control interfaces, or changes to surrounding equipment, like conveyor systems or overhead crane pathways. Integration with existing Manufacturing Execution Systems (MES) or enterprise resource planning (ERP) systems for data logging and control can also add to these initial costs, potentially adding another $2,000 to $20,000 depending on complexity.
- Import and Regulatory Costs: If sourced internationally, consider import duties, taxes, and shipping costs. Additionally, ensuring compliance with regional safety standards (e.g., OSHA in the US, CE marking in Europe) might involve certification costs or modifications, as regional regulatory frameworks significantly impact operational strategies.
Ongoing Operational Costs:
These are the recurring expenses associated with the day-to-day operation and upkeep of the mold flipper.
- Maintenance Costs: Like any industrial machinery, mold flippers require regular preventive and corrective maintenance to ensure optimal performance, safety, and longevity. This includes routine checks, lubrication, calibration, and the replacement of wear parts (e.g., bearings, seals, hydraulic hoses, motors). A robust preventative maintenance schedule can minimize unplanned downtime. Annual maintenance budgets typically range from 1-3% of the initial purchase price.
- Energy Consumption: Electric mold flippers contribute to the facility’s electricity bill, while hydraulic systems also have power unit consumption. Pneumatic systems incur costs related to compressed air generation. The energy consumption should be estimated based on the flipper’s power rating, duty cycle, and local energy prices. For example, a 5kW motor running 4 hours/day at $0.12/kWh would cost approximately $2.40/day.
- Labor Costs (Operation): While mold flippers are often implemented to reduce overall labor requirements for mold handling, there will still be labor associated with operating the equipment. This includes the time spent by trained operators loading molds, initiating the flipping sequence, and unloading. These costs should be calculated based on the operators’ wages, benefits, and the proportion of their time dedicated to operating the flipper.
- Consumables and Replacement Parts: Beyond routine maintenance, some flippers may require consumables like hydraulic fluid, specialized lubricants, or filters. A budget for the eventual replacement of more significant wear parts not covered under typical maintenance (e.g., specific sensors, control panel components) should also be allocated. This could be an additional 0.5-1% of the purchase price annually.
- Insurance Costs: The introduction of new, valuable equipment might marginally increase property insurance premiums, although improved safety might lead to reductions in workers’ compensation premiums, creating a balancing effect.
| Cost Category | Type | Estimated Range (USD) | Key Considerations |
|---|---|---|---|
| Purchase Price | Initial | $10,000 – $100,000+ | Capacity, automation, features, vendor |
| Installation | Initial | $1,000 – $15,000+ | Complexity, facility modification, downtime |
| Training | Initial | $500 – $5,000 | Number of staff, on-site/off-site, training depth |
| Customization | Initial | $2,000 – $20,000+ | Workflow integration, specialized fixtures, MES/ERP link |
| Annual Maintenance | Ongoing | 1-3% of Purchase Price | PM schedule, wear parts, labor |
| Annual Energy | Ongoing | $500 – $2,000+ | Power rating, usage hours, energy cost |
| Annual Operating Labor | Ongoing | Variable | Operator wages, time allocated |
| Consumables/Spare Parts | Ongoing | 0.5-1% of Purchase Price | Fluids, filters, minor components |
By meticulously itemizing and estimating both initial and ongoing costs, a solid foundation for the "cost" side of the financial impact assessment is established. Accurate cost assessment is paramount for making informed investment decisions and for comparing against the projected benefits.
2. Quantifying the Benefits of Mold Flipper Integration
The advantages of integrating mold flippers are diverse, encompassing enhanced operational efficiency, improved workplace safety, and direct cost reductions. Translating these improvements into quantifiable financial terms is crucial for a robust assessment of the technology’s financial impact and its contribution to overall business performance.
Quantifying the benefits of mold flipper integration involves measuring improvements in mold handling cycle times, calculating labor cost reductions from automation, estimating savings from reduced workplace injuries and mold damage, and assessing increased throughput. These measurable financial gains are then compared against the investment and operational costs to determine the overall financial viability.**
Measuring True Value: Translating Operational Improvements into Financial Gains
To truly understand the financial impact of mold flipper integration, we must convert their operational advantages into measurable financial metrics. This involves a detailed analysis of improvements in efficiency, enhancements in safety leading to cost avoidance, and direct cost savings. Technological advancements in mold flipping machines, incorporating automation and smart technology, are key demand drivers, with companies realizing productivity improvements of up to 30%.
Efficiency Gains:
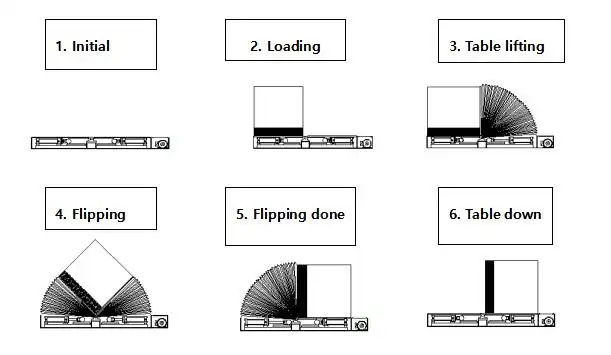
- Reduced Mold Handling Cycle Time: Mold flippers drastically reduce the time required for mold changeovers, maintenance access, and preparation.
- Measurement: Compare the current average time for manual mold handling/flipping tasks against the projected time with a mold flipper. For instance, if a manual mold turn takes 1.5 hours with 3 technicians and a mold flipper achieves this in 20 minutes with 1 technician, the time saving is significant.
- Financial Quantification: (Old Time – New Time) x Frequency of Operations/Year x (Blended Hourly Labor Rate x Number of Staff Reduced). This directly translates to labor cost savings per operation. Additionally, reduced cycle time contributes to increased machine uptime and overall throughput. If faster changeovers allow for 2 extra production runs per week, quantify the profit from these additional runs.
- Optimized Machine and Labor Utilization: By automating the flipping process, skilled labor is freed from strenuous, time-consuming manual tasks and can be redeployed to more value-added activities. Production machinery (e.g., injection molding machines) experiences less downtime awaiting mold services.
- Measurement: Track the current downtime of primary production machinery due to mold handling. Estimate the reduction in this downtime.
- Financial Quantification: (Downtime Reduction per Event) x (Number of Events per Year) x (Cost of Machine Downtime per Hour). The cost of machine downtime includes lost production, operator wages during idle time, and energy.
- Improved Workflow and Throughput: Streamlined mold handling reduces bottlenecks in the production flow, leading to smoother overall operations and potentially increased plant capacity.
- Measurement: Analyze production output before and after potential integration.
- Financial Quantification: (Increase in Units Produced per Period) x (Profit Margin per Unit). Or, (Reduction in Lead Time) translated into competitive advantage or ability to take on more orders.
Safety Improvements and Associated Cost Avoidance:
- Reduced Risk of Workplace Injuries: Manual handling of heavy, unwieldy molds is a primary cause of musculoskeletal injuries, crush injuries, and strains. Mold flippers significantly mitigate these risks.
- Measurement: Track historical data on the number of injuries related to manual mold handling, associated workers’ compensation claims, medical costs, and lost workdays.
- Financial Quantification: Estimate the reduction in these costs. This includes direct savings from fewer claims (e.g., average claim cost reduction of $X per avoided injury) and indirect savings from reduced insurance premiums, less lost productivity due to absenteeism, and avoidance of potential regulatory fines. A safer workplace also boosts employee morale.
- Minimized Mold Damage: Accidental drops or improper handling during manual flipping can cause severe damage to expensive molds, leading to costly repairs or premature replacement. Mold flippers provide controlled, precise movement.
- Measurement: Track historical costs of mold repair and replacement due to handling incidents.
- Financial Quantification: (Average Cost of Mold Damage per Incident) x (Reduction in Incident Frequency). This also includes the cost of production downtime while a mold is being repaired or replaced. Extended mold lifespan due to gentler handling is another benefit.
Direct Cost Savings:
- Labor Cost Reduction: Automating the flipping process reduces the number of personnel required for the task.
- Measurement: Compare man-hours required for mold handling before and after.
- Financial Quantification: (Reduction in Man-Hours per Operation) x (Number of Operations per Year) x (Average Fully Burdened Labor Rate). Industries report an average reduction of 20% in direct labor costs after implementing automated solutions for similar tasks.
- Reduced Mold Repair/Replacement Costs: As detailed under safety, controlled handling directly cuts down on expenses for fixing or replacing damaged molds.
- Lower Insurance Premiums: A demonstrable improvement in safety records can lead to negotiations for lower workers’ compensation and potentially general liability insurance premiums.
- Financial Quantification: Consult with insurance providers for potential premium reductions based on the implementation of such safety-enhancing equipment.
- Material Waste Reduction (Indirect): Improved mold condition and faster, more consistent changeovers can lead to reduced scrap rates during initial production runs after a mold change.
- Measurement: Track scrap rates associated with mold changes.
- Financial Quantification: (Reduction in Scrap Material per Changeover) x (Cost of Material) x (Number of Changeovers).
By meticulously quantifying these benefits using historical data, operational analysis, and realistic projections, the "benefit" side of the financial impact assessment becomes robust. This allows for a clear comparison against the identified costs, paving the way for calculating key financial metrics.
3. Performing the Cost-Benefit Calculation
Once all costs and benefits associated with mold flipper integration have been meticulously identified and quantified, the subsequent step is to perform the cost-benefit calculation. This critical phase involves comparing total projected costs against total anticipated benefits over a defined period, employing established financial metrics.
Performing the cost-benefit calculation for mold flipper integration requires aggregating all quantified annual benefits (e.g., labor savings, increased output, reduced damages) and subtracting annual operating costs, then comparing this net annual benefit against the initial investment. Key metrics like Return on Investment (ROI), Net Present Value (NPV), and Payback Period are calculated to determine financial attractiveness and justify the capital expenditure.**

Strategic Financial Metrics: Gauging Investment Worthiness with ROI, NPV, and Payback Period
Choosing appropriate financial metrics is crucial for accurately interpreting the results of your cost-benefit analysis. Return on Investment (ROI), Net Present Value (NPV), and Payback Period are three commonly used metrics that provide different perspectives on the financial viability of investing in a mold flipper. Ideally, all three should be calculated to provide a comprehensive financial picture.
Return on Investment (ROI)
ROI is a fundamental profitability metric that expresses the net gain from an investment as a percentage of its total cost. It provides a straightforward measure of the efficiency of the investment.
- Formula:
ROI = ((Total Benefits – Total Costs) / Total Costs) * 100% - Calculation:
- Sum all quantifiable benefits over a chosen analysis period (e.g., 5 years).
- Sum all costs (initial investment + cumulative ongoing operational costs) over the same period.
- Apply the formula.
- Interpretation: A positive ROI indicates profitability. The higher the ROI, the more attractive the investment. Companies often have a minimum acceptable ROI (hurdle rate) for capital projects.
Example ROI Calculation (5-Year Period):
Assume:
- Initial Investment (Purchase, Install, Training): $80,000
- Annual Operating Costs (Maintenance, Energy, etc.): $5,000
- Total Annual Quantifiable Benefits (Labor Savings, Efficiency, Reduced Damage, etc.): $50,000
| Category | Year 1 | Year 2 | Year 3 | Year 4 | Year 5 | Total (5 Years) |
|---|---|---|---|---|---|---|
| Total Benefits | $50,000 | $50,000 | $50,000 | $50,000 | $50,000 | $250,000 |
| Initial Cost | $80,000 | $0 | $0 | $0 | $0 | $80,000 |
| Ongoing Costs | $5,000 | $5,000 | $5,000 | $5,000 | $5,000 | $25,000 |
| Total Costs | $85,000 | $5,000 | $5,000 | $5,000 | $5,000 | $105,000 |
| Net Benefit/Cash Flow | -$35,000 | $45,000 | $45,000 | $45,000 | $45,000 | $145,000 |
ROI = (($250,000 – $105,000) / $105,000) 100% = ($145,000 / $105,000) 100% ≈ 138.1%
Net Present Value (NPV)
NPV accounts for the time value of money, recognizing that a dollar today is worth more than a dollar in the future due to inflation and investment potential. It discounts all future net cash flows back to their present value.
- Formula:
NPV = ∑ [Net Cash Flow in Year t / (1 + Discount Rate)^t] – Initial Investment
(Where t is the year, and the summation is from year 1 to the end of the analysis period. The Initial Investment is typically considered at t=0) - Calculation:
- Determine the net cash flow (Annual Benefits – Annual Ongoing Costs) for each year.
- Choose an appropriate discount rate (often the company’s weighted average cost of capital – WACC, or a minimum required rate of return).
- Discount each year’s net cash flow to its present value.
- Sum the present values of all net cash flows.
- Subtract the present value of the initial investment (which is its actual cost at Year 0).
- Interpretation: A positive NPV indicates the investment is expected to generate more value than it costs, in today’s dollars. A higher NPV is generally better.
Example NPV Calculation (using data above, 8% discount rate):
| Year | Net Cash Flow | Discount Factor (8%) | Present Value |
|---|---|---|---|
| 0 | -$80,000 | 1.000 | -$80,000 |
| 1 | $45,000 | 0.926 | $41,670 |
| 2 | $45,000 | 0.857 | $38,565 |
| 3 | $45,000 | 0.794 | $35,730 |
| 4 | $45,000 | 0.735 | $33,075 |
| 5 | $45,000 | 0.681 | $30,645 |
| NPV | $99,685 |
An NPV of $99,685 suggests the investment is financially sound.
Payback Period
The Payback Period calculates the time it takes for an investment’s cumulative net benefits to equal its initial cost. It’s a measure of liquidity and risk.
- Calculation:
Track the cumulative net cash flow year by year. The Payback Period is when the cumulative cash flow turns positive.
For fractional years: Payback Period = Last Year with Negative Cumulative Cash Flow + (Absolute Value of Cumulative Cash Flow at End of That Year / Cash Flow in the Next Year) - Interpretation: A shorter payback period is generally preferred, as it signifies a quicker return of the initial capital outlay, reducing investment risk.
Example Payback Period Calculation:
| Year | Net Cash Flow | Cumulative Cash Flow |
|---|---|---|
| 0 | -$80,000 | -$80,000 |
| 1 | $45,000 | -$35,000 |
| 2 | $45,000 | $10,000 |
The investment is paid back within Year 2.
Payback Period = 1 year + ($35,000 / $45,000) years = 1 + 0.78 years ≈ 1 year and 9.4 months.
A strong positive ROI, a significant positive NPV, and a reasonably short Payback Period collectively provide a compelling financial justification for mold flipper integration.
4. Considering Intangible Benefits and Qualitative Factors
While quantifiable financial metrics like ROI, NPV, and Payback Period are essential for assessing the financial impact of mold flipper integration, a truly comprehensive analysis must also incorporate intangible benefits and qualitative factors. These elements, though harder to assign a direct monetary value, can significantly influence the overall strategic value and long-term success of the investment.
Beyond direct financial returns, intangible benefits of mold flipper integration include improved employee morale due to safer and less strenuous working conditions, enhanced company reputation through a demonstrated commitment to modern technology and safety, superior quality control stemming from precise mold handling, and increased operational flexibility and responsiveness. These qualitative factors, while not easily fitting into formulas, are critical considerations that complement the quantitative analysis, providing a holistic view of the investment’s true worth. For example, approximately 85% of consumers believe companies should promote sustainability; efficient, waste-reducing equipment can indirectly bolster this aspect of reputation.**
Beyond the Numbers: Morale, Reputation, Quality, and Flexibility
Not every benefit derived from capital investment can be neatly captured in a spreadsheet. The qualitative aspects often contribute substantially to a company’s operational excellence, competitive positioning, and overall organizational health.
Improved Employee Morale, Safety Culture, and Retention:
- Safer Working Environment: The most significant intangible benefit is often the improvement in workplace safety. Reducing the risk of injuries by automating hazardous manual tasks like mold flipping demonstrates a genuine commitment to employee well-being. This fosters a stronger safety culture, where employees feel valued and secure.
- Enhanced Ergonomics and Job Satisfaction: Eliminating strenuous physical labor and awkward postures associated with manual mold handling reduces physical strain and fatigue. This leads to greater worker comfort, improved focus, and higher job satisfaction. A more satisfied workforce is generally more engaged, productive, and less prone to errors.
- Attraction and Retention of Talent: Modern, well-equipped facilities that prioritize safety and efficiency are more attractive to skilled workers. Investing in such technologies can aid in recruiting top talent and reducing employee turnover, thereby saving on recruitment and training costs associated with replacing staff. Industries facing skill shortages are particularly motivated to invest in automation that makes jobs safer and less physically demanding.
- Modernized Workplace Perception: Employees often take pride in working with advanced, efficient equipment. This can boost morale and foster a sense of working for a forward-thinking, competitive organization.
Enhanced Company Reputation and Brand Image:
- Commitment to Safety and Innovation: Adopting advanced technologies like mold flippers signals to customers, suppliers, potential employees, and the wider community that the company is committed to safety, efficiency, and innovation. This can enhance brand image and build trust.
- Operational Excellence as a Selling Point: A reputation for operational excellence, facilitated by efficient internal processes, can be a competitive differentiator. Customers are increasingly looking for reliable suppliers who can consistently meet quality and delivery expectations.
- Sustainability Credentials (Indirect): While not all mold flippers directly impact environmental sustainability, those that contribute to reduced material waste (through less mold damage and fewer production errors) or are energy-efficient can bolster a company’s green initiatives. Growing awareness of sustainability influences purchasing choices, and eco-friendly operations can appeal to a broader customer base and improve investor relations.
Enhanced Quality Control and Product Consistency:
- Precise and Gentle Mold Handling: Automated mold flippers offer controlled, repeatable, and precise movement, minimizing the risk of accidental damage to molds that could otherwise go unnoticed and affect part quality. Consistent mold positioning ensures uniformity in the molding process.
- Reduction in Human Error: Automating the flipping process reduces the variability and potential for human error inherent in manual operations. This leads to more reliable mold conditions and, consequently, more consistent product quality and fewer defects.
- Improved Process Control: Greater consistency in mold handling contributes to overall process stability, making it easier to identify and address other sources of variation in the manufacturing cycle.
Increased Operational Flexibility and Responsiveness:
- Faster Product Changeovers: The ability to flip and prepare molds more quickly, as quantified in the benefits section, also translates into greater agility. Manufacturers can respond more rapidly to changing customer demands or switch between different product runs with less downtime.
- Adaptability to Diverse Mold Types: Modern mold flippers can often handle a range of mold sizes and weights, providing versatility to accommodate a wider variety of projects and customer requirements.
- Foundation for Scalability: Efficient mold handling systems establish a more robust operational foundation, making it easier to scale production volumes to meet future growth without proportional increases in labor or handling-related bottlenecks.
Integrating Qualitative Factors into the Decision-Making Matrix:
While these factors don’t directly enter ROI or NPV formulas, they should be systematically evaluated:
- Qualitative Scorecard: Develop a scorecard where each intangible benefit is rated on its potential impact (e.g., low, medium, high) and its strategic importance to the company.
- Risk Assessment: Consider the risks of not investing – e.g., continued safety hazards, loss of competitive edge due to inefficiency, difficulty attracting labor.
- Strategic Alignment: Evaluate how the investment aligns with broader company goals, such as becoming an industry leader in safety, quality, or innovation.
- Stakeholder Input: Gather perspectives from various departments (operations, safety, HR, sales) to get a holistic understanding of potential impacts.
A comprehensive financial impact assessment for mold flipper integration judiciously blends hard financial data with a thoughtful consideration of these softer, yet often critical, qualitative benefits. This balanced approach ensures that investment decisions are not only financially sound but also strategically aligned with the long-term vision and values of the company.
Conclusion
Assessing the financial impact of mold flipper integration is a multifaceted process crucial for strategic capital allocation. It demands a meticulous evaluation of all initial and ongoing costs against a spectrum of quantifiable benefits, including enhanced efficiency, significant labor cost reductions, improved workplace safety, and minimized mold damage. By employing financial metrics like ROI, NPV, and Payback Period, businesses can objectively gauge the investment’s monetary returns. Furthermore, incorporating intangible benefits such as improved employee morale, enhanced company reputation, superior quality control, and increased operational flexibility provides a holistic view, ensuring the decision aligns with broader strategic goals and contributes to sustained profitability and competitive advantage.


